
July 8, 2013
The stock and commodities markets' bear correction is finally over
Commentary by Senior Market Strategist Robert Balan
«The public is right during the trends, but wrong at both ends.»
Humphrey Neill
The volatility in the developed asset markets has been exacerbated and amplified by the recent turmoil seen in the emerging markets. Both emerging market bonds and equities have recently been devastated by the following factors, in turn: Mr. Ben Bernanke's miscommunication of the Fed's desire to "taper" QE Infinity's monthly bond purchases, which caused an unwind of the risk trade (and more so in EM bond and equities), and a slower growth expectations, and a PBoC-driven liquidity squeeze in China.
By the end of June, there's plenty of evidence that the storm that had battered the asset markets was abating. Breadth indicators had reached oversold levels but have indicated a turn (for at least a month). Fear levels have bottomed and were starting to recede. The question now is whether the recent setback was just a minor correction of a bigger bullish impulse in stock and commodity prices. Or, to make allowances for various alternatives, any subsequent bounce from here will not last very long and will be followed by further declines. The fear of premature Fed tapering threw a scare into all asset markets but specially devastated emerging markets.
The QE Infinity's promise of cheap money for a long time pushed a lot of "hot money" into the EM space in the search for yield. So the prospect of a premature unwinding of the Fed-supplied liquidity source caused the "hot money" to rush for the exits, precipitating large losses. The carnage was particularly bloody in emerging market equities. EM equities staged a relative rally after the Lehman Crisis but topped out in 2010 and they have been underperforming global equities ever since. Earlier this year, MSCI EM broke an important relative support level against MSCI G7 and has been plunging ever since. From a technical viewpoint, the bottom has yet to materialize. Emerging market bonds, however, tell a happier story.
EM bond prices recovered recently, not only against U.S. high yield, but against 7-10 year Treasuries as well. The recent flight out of EM assets did not affect EM bonds as much. Nonetheless, our traders instinct tells us that the equity and commodities markets’ bearish correction is over, although the jury is still out insofar as a recovery in EM equities is concerned.
The market saw oversold conditions on a number of indicators and the VIX Index hit levels that saw the end of past corrections. Also, as we mentioned earlier, our short-term equity directional indicator derived from the NYSE’s advance-decline data has turned as well. The key evidences were the reversals in these short-term indicators.
As for commodities, the strong recovery in the energy sector has been a driver of the asset class as a whole. WTI crude oil prices rose to the highest level since January 2012, while Brent crude oil prices increased by more than 6% since the third week of June and broke its resistance level last Friday. The upward move could continue driven by tighter fundamentals. Base metals have recovered in varying degrees -- Copper has resisted quite well in comparison to other metals (-6% in the past month vs. -12% as for nickel, -11% as for tin, -10% as for aluminium) as the market appears tighter than expected, given the heavy production disruptions in the US, Indonesia and the global shortage in scrap copper supply. Copper, tin and lead should remain top picks in the second half of the year, as these metals should report strong supply-demand fundamentals.
 |
Main drivers this week
|
Commodities and Economic Highlights
Commentary by Robert Balan, Alessandro Gelli, Marion Megel and Alban De Rougé
Supply issues continue to drive oil prices higher
Several factors have contributed to the recent oil price rally. The most important element is supply issues amid rising tighter seasonal fundamentals. Indeed, political instability in Egypt is a big concern for the oil market as the country control the Suez Canal and the SUMED pipeline, which are important transit points for oil shipments and accounted for 6% of global crude oil trade in 2011.
Moreover, in June 2013, Iraqi crude oil exports fell to 2.33 million b/d, down 150’000 b/d m/m and down 75’000 b/d y/y. This was the first annual decline since February 2012 and the lowest level in 16 months and was caused by bad weather in the southern part of the country and because of attacks against the Kirkuk—Ceyhan pipeline in the northern part of the country. In Libya, crude oil exports remain volatile due to protest and growing insecurity.
These supply disruptions occurred, while the oil market is tightening seasonally. Global refining activity is increasing to respond to stronger seasonal oil demand. Global crude runs are expected to reach 77.4 million b/d in August 2013, up 2.8 million b/d from May 2013, while less Russian crude oil will be available on the market due to rising local refining activity. Saudi Arabia is also expected to see its domestic demand rise in July and August due to higher temperatures. These factors are adding upside pressure on oil prices.
New sanctions should prevent a rebound in Iranian crude oil exports
In the Middle East, another important oil producer is currently having an impact on the oil market. Indeed, while the tight oil boom continues in the US, making the country the largest contributor to global oil supply growth, Iranian crude oil production fell sharply due to international sanctions. This led to a decline of 1.0 million b/d between May 2011 and May 2013 of Iranian crude oil production. Lower crude oil exports led to a decline in crude oil production due to the lack of storage capacity.
Lower Iranian crude oil exports have tightened the medium sour crude oil market that cannot be easily replaced by light sweet crude oil such as the one from West Africa, which used to be sent to the US but is now being substituted by light sweet crude oil from US tight oil wells. Stronger Asian demand for medium sour crude oil (as refining activity is increasing) and the recent renewal of the US waiver on Iranian crude oil exports for some Asian countries may fail to lift Iranian crude oil exports in the coming weeks like it usually did before. Indeed, new US sanctions on Iran have been implemented on July 1st 2013 and are making more difficult payments for Iranian crude oil by prohibiting gold trade with Iran, that was used to circumvent previous financial sanctions.
The lack of Iranian crude oil is pushing higher demand for Saudi medium sour crude oil, a quality similar than Iranian crude oil. With stronger domestic and foreign demand, the kingdom is encouraged to push its crude oil production higher. In May 2013, Saudi Arabia increased crude oil output to 9.6 million b/d, the highest level since November 2012. Stronger production is expected to reduce its spare capacity estimated by the IEA at 12.3 million b/d and is especially important now due to the growing geopolitical tensions in the Middle East and North Africa.
Lead’s weakness is seasonal and is unlikely to persist
Lead’s poor performance of the past weeks has not come as a surprise because the metal has entered its weakest season. The period from May to early-July is usually influenced by lower demand from battery producers, which usually start rebuilding their inventories from July-August, anticipating the peak winter season when car batteries need to be replaced. Also, the summer months should be stronger from electric bikes demand, as this type of transportation is usually preferred and purchased in the warm months.
Another element can explain the recent weakness in lead prices: scrap supply has eased. Physical premiums in the US and in Europe have much decreased since March this year: in the US, a consumer may now pay $245/tonne on top of the LME price to secure the delivery of the material, down from $280/tonne at the end of the first quarter. Similarly, European premiums have fallen from $150/tonne in March 2013 to $100/tonne recently. In Asia, they have remained flat. This easing in scrap availability must really be seen as a normal correction, as scrap lead had become so expensive that costs of processing scrap were higher than refined lead prices. This was clearly unsustainable, explaining the recent ease in scrap prices. In addition, key secondary lead smelters have been closed in the past months, including Exide’s 90,000tpy Vernon smelter; and Chinese smelters are reporting extremely tight margins at the moment (about 10%, compared with margins between 15% and 35% from 2004 to 2008). Lead supply remains structurally tight and should bring the global market into deficit this year.
Old crop tightness contrasts with large supply response
Grain markets were recently affected by two quarterly reports. The last U.S.D.A. reports (Grain Stocks and Acreage report) confirmed the tightness in old crop inventories and reiterated the potential large supply response. Indeed, June corn stocks in the US were reported at 2’764 million bushels, the lowest level since the season 1997-98. This data implies that corn feed and residual use was stronger than expected, reversing the weak use implied by the March stocks report. The combination of this robust demand and recent strength in ethanol production means that corn supplies will fall to critically low levels this summer.
With 718 million bushels of wheat stocks, the same observation can be made: feed and residual demand were larger than expected. But, unlike corn, this level of stocks is similar with previous years. Only soybean stocks were in line with expectations, at 435 million bushel. However, it is the smallest level in nine years and domestic crush has to slow considerably this summer in order to get 125 million bushels of ending stocks, as forecasted by USDA.
Regarding the Acreage report, the area used for planting corn came in at 97.4 million acres, which is 2 million acres above consensus expectation. This data suggests that acreage will be close to last year’s level, removing a downside risk to new crop production. Soybean acreage was reported at 77.7 million acres, in line with analysts’ estimates. However, due to a large share of planting taking place during the Acreage survey, the USDA indicated that producers in 14 states will be re-surveyed in July to determine if plantings deviated from intentions.
Therefore, old crop contracts, July maturity, performed well this month due to the low level of stocks: +4% on soybean and +3% on corn. However, prices of new crop contracts, September or November maturity, fell heavily because of this large area used: -4% for soybean and -8% for corn.
Chart of the week: Gold’s sell-off driven by rising real interest rates, positive sentiment over the USD
|
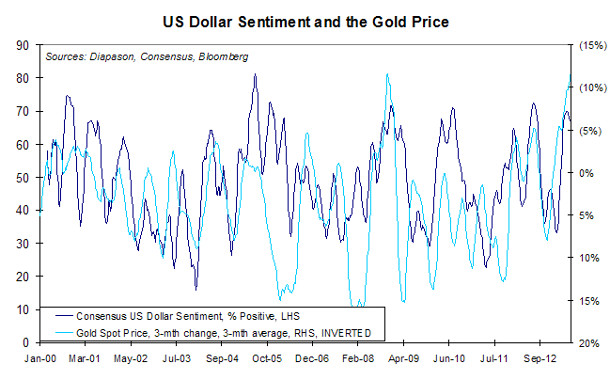
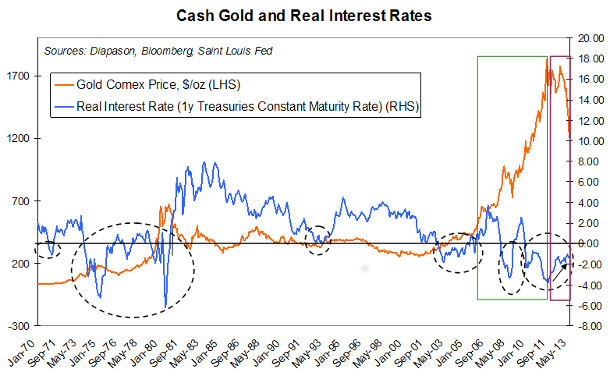
Gold prices have fallen further since the Fed Chairman Ben Bernanke suggested it would tapper QE Infinity’s monthly Treasury and MBS purchases if the Fed’s economic and employment forecasts are realised. Last week, the gold spot price hit its lowest level since the second quarter of 2010, just above $1,200 an ounce. Investors have completely turned their back on gold and the solid physical demand from Asia has not been sufficient to compensate at all. The world’s ETF holdings are now at their lowest level since May 2010 and the Comex net speculative positions on gold are now near the net short territory, back to their lowest level since 2002. The main drivers to investors’ lack of interest in gold are, unsurprisingly, the rise in real interest rates, the capitulation on inflation fears and the positive sentiment over the US dollar. These three elements create the perfect environment for declining gold prices, this is why we expect gold to underperform industrial metals and energy in the coming months. We believe however that these scenarii lack solid grounding, and in particular, that the markets panicked and ignored part of Ben Bernanke’s comments, i.e. the economic requirements. Gold consequently still appears oversold at current levels. |
|
|
For the full version of the Diapason Capital Markets report, please contact info@diapason-cm.com