
July 1, 2013
What happens to risk asset prices and GDP when bond yields rise?
Commentary by Senior Market Strategist Robert Balan
«Investment decisions should focus first and foremost on markets and asset classes. Over time, that is going to explain roughly ninety percent of investment returns. »
Gary Brinson, Brinson Partners
It is fair to ask this question after the market paroxysm of the past several days, when all asset prices were hammered following Fed Chairman Ben Bernanke's indication of the Fed's desire to taper QE Infinity's monthly Treasury and MBS purchases. He pointed to the middle of 2014 as target for widening down those purchases -- if the Fed's economic and employment forecasts are realized.
The investment world panicked: more than $4trln worth of assets values were wiped out in just a few days. What we really saw in the past two weeks was not a move out of bonds, or stocks, or gold and base metals, but rather a repricing among the asset classes, and among the sectors within each asset class as well. One significant point about the recent market sell-off is not that the risk-off trade materialized in markets around the world, from developed markets' equities to the non-G4 currencies to Emerging Market debt and equities -- everything was trashed. Even the traditional bastions of safety performed badly -- all sovereign bonds (with the noteworthy exception of Japanese JGBs) were hammered. Just to underline the unusual character of the sell-off, commodities outperformed everything else.
Yields have also risen further following the June 18-19 FOMC meeting, but all that we can attribute to Mr. Bernanke's maladroit PR performance are some 55 basis points of 10yr yield increase. Yields have actually been rising since Q3 of 2012, after the 10yr bond bottomed at just above 1.380% in late July 2012. So why then are bond yields rising? Primarily, bond yields have gone artificially low earlier this year and the paroxysm of the past week returns bond yields to more normal levels. Also, the long rally in equities is an indication that investors' sentiment has healed, and therefore, bonds are losing their safe haven appeal. Also, growth prospects in the US, although not superb, have improved.
Even more importantly, what happens when bond yields rise? Rising long-term rates are usually a positive indicator for growth and asset prices; and central bank's reaction function is to tighten policy accordingly so as not to let the process overheat. So a less accommodative Fed has historically been bad for bonds but good for stocks and commodities.
As usual, and history bears us out, the transition from a period of easy monetary policy to a more neutral monetary stance always produces volatility. Does this volatility presage a bear market in riskier asset classes? Our experience suggests that this is not the case this time around. Bear markets of riskier asset prices are normally associated with central bank tightening to prevent run-away growth (which provoke recessions) – bear markets are not associated with tightening in economies that are just growing sufficiently for the central banks to remove some of the ultra-easy monetary conditions that are prevailing at this time. Thus, we see the ongoing sell-off in riskier assets as a correction in a bull market that can run until year-end or even spill-over into Q1 2014.
But the Fed, and indeed any central bank, has not been able to eliminate the business cycle, and so we do see asset prices lower in most of 2014 as the Fed carries out what it intends to do (as advertised) and the market will front-run the Fed as usual. That will inevitably cause a decline in riskier asset prices, which to some extent will impact real activity as well, bringing on recession-like conditions in late part of 2014.
 |
Main drivers this week
|
Commodities and Economic Highlights
Commentary by Robert Balan, Alessandro Gelli, Marion Megel and Alban De Rougé
Brent-WTI spread fell due to floods in Canada and stronger refining activity
Early last week, the Brent-WTI spread broke its $7 support level and fell to around $6, the lowest level since January 2011, when the spread started to widen significantly. This was caused by an important outperformance of the front month WTI.
The trigger was the flood in Alberta that halted major pipelines amid the restart of two large refineries in the US Midwest. The 345'000 b/d Athabasca pipeline and the 600'000 b/d Waupisoo pipeline were shut during several days after a spill (caused by the heavy flooding) on a smaller line was discovered during the weekend. These pipelines are among the largest pipelines which carry crude oil from the northern production centers to the storage and pipeline in Hardisty in Alberta, connecting to main export pipelines for the US Midwest. Other smaller pipelines were also temporarily affected. Two weeks ago, Spectra Energy had to shut for 2 days its 280'000 b/d Express pipeline that carries crude from Hardisty to the US Midwest after heavy flooding caused some communication issues.
Therefore, Canadian crude exports to the US are expected to decline. This is occurring while refining activity is expected to increase in the Midwest. Indeed, ExxonMobil’s 238’000 b/d Joliet refinery in Illinois has recently restarted activity after having performed maintenance work. Moreover, a crude unit at BP’s 405’000 Whiting refinery is in the process of restarting after having been upgraded. The plant can now run up to 350’000 b/d of heavy Canadian crude oil, up from about 80’000 b/d.
Stronger crude demand and lower supply have hence pushed higher the front month WTI price (that was also reflected in the wider backwardation) and contributed to the narrower Brent-WTI spread. The restart of the Canadian pipelines and crude oil inventories in the Midwest close to record high levels are likely to prevent the spread from falling significantly below $6 during a sustained period.
Natural gas: growing fears of the supply glut's return
US natural gas prices fell sharply last Thursday after the last EIA report on US natural gas storage. Net injections into storage stood at +95 billion cubic feet (bcf) over the week, above market's expectations of +87 bcf. This above than expected build in natural gas inventories followed several weeks of stronger than expected net injections into storage. This was caused by the ongoing strength in dry natural gas production which keeps increasing. Two weeks ago, dry natural gas production was still up by 1.2% y/y, driven by stronger output in the Marcellus Shale on the US East Coast. In May 2013, dry shale gas production in the Marcellus shale indeed reached 9.3 bcf/d, up 51.2% y/y (+3.2 bcf/d). The second largest rise in output occurred in the Eagle Ford Shale in Texas, where production increased to 2.7 bcf/d up 41.2% y/y (+0.8 bcf/d) and contributed to the rise in overall dry shale gas production to 28.7 bcf/d, up 9.7% y/y. Shale gas production now accounts for 43.0% of total dry gas production.
The rise in these two reservoirs contrasted with strong declines in more mature areas such as the Barnett Shale in Texas (-4.5% y/y in May 2013), the Woodford shale in Oklahoma (-14.7% y/y) and the Haynesville shale in Louisianna and Texas (-15.9% y/y) as lower natural gas prices discouraged drilling. On the other hand, new wells and pipelines in the Marcellus shale should contribute to the growth in natural gas output and therefore mitigate the decline elsewhere. A large amount of wells remained uncompleted due to the lack of fracking crews, equipment or infrastructure to move the gas out of the field. Thus, the completion of the wells could occur even with lower prices, especially in the Marcellus shale which is located near the largest consuming region.
On the demand side, power plants continued to reduce their use of natural gas due to the high price of natural gas relative to coal. According to Bentek Energy, US natural gas demand was down 7.7% y/y two weeks ago, driven by a sharp decline in natural gas consumption from the power sector (-16.4% y/y). The recent decline in natural gas prices coincided with lower US coal prices, reflecting the significance of the power sector in both markets. Demand from the power sector accounted in 2012 for 92.5% of overall US coal demand, while it accounted for 38.1% of overall US natural gas demand (with a peak at 52.7% in July 2012). Higher coal prices relative to natural gas are hence needed in the short run to see a higher use of natural gas by the power sector.
On the longer run, natural gas should benefit from new regulations on carbon emissions announced last week by President Obama. Until then, the fear of the supply glut's return is increasing. As prices may have only a limited impact on US natural gas production growth in the short run, only warmer than normal temperatures (that could boost power demand) or higher coal prices could lead to a rebound in natural gas prices in the coming weeks.
Current PGMs prices could represent buying opportunities
PGMs prices fell abruptly after the Fed’s June 18-19 FOMC meeting. Platinum indeed fell down to its lowest level since late-2009 and palladium to its lowest level since late-2012, before bouncing back on Friday, June 28. We consider these levels as strong buying opportunities given the tight supply-demand balances of both metals, whose prices are expected to recover quickly.
In addition, these imbalances are structural, providing platinum and palladium with remarkable medium and long term prospects. At the crux of these deficits stands South Africa, where 75% of the world’s platinum is produced. Production has long been endangered by rapid and strong rises in labour and energy costs. The growing unionisation of workers, who’s labour represent 55% of the platinum cash costs, have led to a series of strikes in the past decade (to reach its paroxysm in August last year when 44 workers died in a clash with the police), and subsequently to double-digit annual pay rises. Since 2001, the average salary in the mining sector has indeed tripled. The situation should remain tense in the coming months, especially since wages will be renegotiated next month, company by company. On top of that, South Africa’s energy security remains fragile: the current low coal inventories in the country poses major threats of power outages. After having risen by an average of 25% annually over the past five years, electricity tariffs should climb by another 16% each of the next five years. Consequently, the country’s output of platinum fell by 16% last year and that of palladium by 9%. As 95% of the world’s PGMs reserves are located in the South African ground, the PGMs market can not ignore South Africa’s problems.
Also, demand prospects are good – and let us say fantastic for palladium. The metal is widely used in the US and Chinese automotive industries, where it is nearly exclusively used to make auto catalysts that limit polluting emissions (platinum is mostly in diesel vehicles, i.e. in Europe). Last year, the sector’s demand for palladium soared by 7% after having risen by 10% in 2011. Considering the strong Chinese and US automotive production statistics since the start of the year, we expect palladium demand to keep rising at a similar pace in 2013. Also, platinum enjoys good prospects in the jewellery sector, especially considering the recent huge Asian appetite for jewels. In April 2013 for instance, China’s imports of platinum hit its fourth highest level ever.
Finally, one of the strongest factor supporting platinum and palladium resides in the fact that China has no PGMs known reserves in its ground, contrary to many other metals – and therefore will need to import more and more of PGMs, as long as its automotive sector will rise.
Coffee prices are likely to stay below production costs
Since the highs of 2011, New-York Arabica coffee prices have tumbled by more than 60% and have almost fully retraced the price rally that started in 2009. Moreover, prices have fallen below production costs in most of the key producing countries. In commodities, the cost of production represents a support to prices as it signals producers to stop supplying. However, this can be different for coffee. Indeed, as coffee is a perennial crop, production response is slow. Coffee trees typically begin to bear fruit 3–4 years after being planted, and continue to produce for 10–20 more years, even with minimal care. Therefore, supply surplus can last a few seasons, pressuring prices further.
For example, the production costs in Brazil, the largest producer and exporter in the world, stand around 300 BRL/bag, due to rising wage costs and input prices. With current prices at 280 BRL/bag, Arabica producers are struggling to make money. But it will not necessarily lead to a drop in production. Indeed, growers in Brazil are starting to harvest a record “off cycle” crop of 53 million bags. Next season, 2014-15, is the “on cycle” crop, therefore another huge crop is expected, even if farmers choose to reduce their fertiliser use due to cost control.
According to Volcafe, a unit of ED&F Man Holdings Ltd, the normal on/off-cycle fluctuation in the last 10 years has been between 20% and 40%. The pattern of on/off-cycle of production is due to coffee trees. The plant growth will focus during one year on branches that will produce coffee beans for the following year, and so on.
Another reason that will push Brazilian growers to produce coffee beans is the government subsidies. The Monetary Policy Council announced a $1.4 billion package for producers. A first part will be lent to cover costs relating to production such as chemical inputs and labour while the other part will be lent to growers who need cash when they delay selling beans to hold out for higher prices.
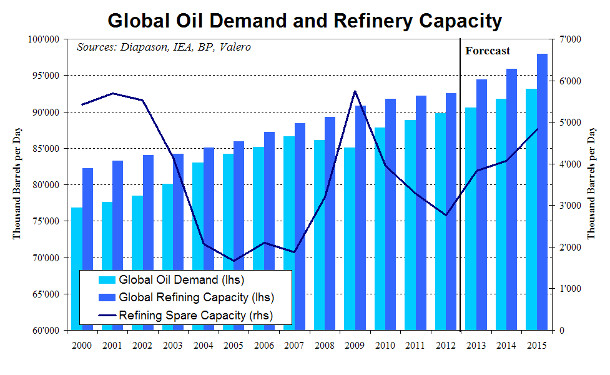
Chart of the week: The increase in refining spare capacity should push crack spreads down
|
The refining sector is still trying to adapt to its new environment that started after the economic crisis in 2008, which also marked the end of the golden age in the refining sector. This golden age was characterised by low spare refining capacity leading to exceptionally high refining margins. Currently, the amount of spare refining capacity is more important but the sector is still evolving due to the rapid rise in non-OECD oil demand, while OECD demand is falling, as well as the US shale boom that helped refineries. In this evolving market, several factors seem to play an important role in the refinery’s performance. Refineries need to be closer (or have a reliable access) to crude oil supply and/or in markets where oil demand is growing. Furthermore, the degree of complexity and/or government’s backing will play an important role in the refinery’s economics. Most European refineries lack these factors. Additional European refining capacity is hence likely to be closed in the near future albeit at a lower pace than the previous years as the least profitable refineries have already been shut down. On the other hand, US refineries are likely to resist to the ongoing decline in domestic demand by increasing exports, especially to Latin American countries which failed to invest enough in their refining sector to respond to their oil demand growth. As opposed to Latin America, Asian countries are about to see a massive increase in their refining capacity. These plans are often politically-driven, reducing the potential impact of low refining margins environment on these projects. Net global refining capacity is hence expected to increase by 1.9 million b/d in 2013 and by 1.5 million b/d in 2014, while the International Energy Agency expects global oil demand to grow by around 1.0 million b/d per year during this period. Moreover Saudi Arabia and China will see their combined refining capacity increase by about 1 million b/d during the second half of 2013, adding downside pressure on crack spreads for the rest of the year. |
|
|
For the full version of the Diapason Capital Markets report, please contact info@diapason-cm.com