
June 24, 2013
Commodities outperform as asset and sector correlations decline
Commentary by Senior Market Strategist Robert Balan
«The most fundamental decision of investing is the allocation of your assets. How much should you own in stocks? How much should you own in bonds? How much should you own in cash reserves? »
John C. Bogle
Following a series of articles heralding the onset of a commodities revival, the outperformance of commodities over equities and other asset classes has become even more pronounced. The asset markets were routed after Chairman Ben Bernanke and the FOMC made a hawkish shift in their reaction function wherein the Fed is seemingly placing a greater weight on the unemployment rate. However, the shift in the Fed's reaction function did not hammer the prices of asset classes equally.
Continuing the trend which became manifest in early May, bond and equity prices fell more than commodity prices. And had the HSBC China "flash" PMI not come on the heels of the Fed's change in stance, commodities would have performed even better during the rout.
The impact of the FOMC meeting on specific commodity sectors had unusual dimensions as well. Ordinarily, within commodity markets it is the precious metals sector (specifically gold), that tends to be most impacted by liquidity issues and sharp changes in interest rates. That gold did not lose as much as it should was a surprise to many analysts, but it should not be -- gold prices had been declining since Q4 last year and had, in fact, dropped precipitously in April following an exodus of investors from gold ETPs. The negative impact from expectations of Fed tapering therefore had a more muted impact on gold prices than might have been the case if prices were on a stronger footing when the market rout happened. This one aspect, in that sense, shielded the commodities complex (as a group) from a worse fate that has struck the other major asset classes.
The other key development that was expected to negatively impact commodities –- that of lower Chinese GDP growth expectations and a weak set of May data –- only briefly moved commodity prices lower. It was also a pleasant surprise because in a linear projection of expected outcomes, the event should have had a severe impact on commodity prices in light of China’s dominance as a commodity consumer and importer. However, that is not what happened -- the impact was muted by the fact that the slowdown in Chinese growth had actually been priced in by commodity markets much earlier in the year.
What the outperformance of commodities in 2013 so far has shown us is that commodity markets have been faster than other risky assets in internalizing a scenario of slowing Chinese growth. An earlier than anticipated end to the Fed’s quantitative easing program has also not impacted commodity markets as much as it has the other asset classes. This has contributed to reduce correlation between commodities and other asset classes.
The period of commodities performance being derived from risk-on/risk-off sentiment-based factors, that contributed to the high correlation between asset prices, has come to a close. And finally, we are getting to a point where supply and demand becomes paramount again, signifying that the investment world is heading towards normalcy. The sooner the investment world is fully weaned from the largesse of the central banks, the better (and more tractable) the financial world will be.
 |
Main drivers this week
|
Commodities and Economic Highlights
Commentary by Robert Balan, Alessandro Gelli, Marion Megel and Alban De Rougé
Tighter coal fundamentals should provide support to natural gas prices
These past few years, US coal exports accelerated due to stronger foreign demand and a large domestic surplus, despite declining coal output. In March 2013, US coal exports reached a new record high at 13.64 million short tons, up 23.4% y/y. Strong European demand for US coal is driven by high natural gas prices in Europe and lower carbon emission prices due to the slow economic activity.
Moreover, on top of strong exports, US coal demand from the power sector continues to rise due to high natural gas prices relative to coal. The EIA expects US coal consumption to increase by 7.1% y/y in 2013, driven by the power sector, contrasting with the decline in coal usage by 11.1 % y/y in 2012 from the same sector. The decline was especially strong in the first part of 2012 (-17.3% y/y in H1 2012 v. -4.8% y/y in H2 2012) due to low natural gas prices relative to coal that encouraged coal-to-gas switching in the power sector. On the other hand, coal production is expected to slightly rebound this year (+0.5% y/y) after falling by 7.1% y/y in 2012.
Strong foreign and domestic demand has allowed a significant reduction in coal inventories. According to the EIA, coal stocks at power plants fell in March 2013 to 173 million short tons, the lowest level since December 2011. This was also the fourth consecutive month that inventories fell. Furthermore, since the beginning of the year the power sector’s coal inventories fell by 6.2%, while they usually increase during this period. Lower inventories should lead to a tighter coal market especially during the summer when demand peaks seasonally. Tighter coal fundamentals should push coal prices higher and contribute to a narrower coal-natural gas price spread, which in turn could reduce gas-to-coal switching, adding support to the US natural gas market.
Crude oil production growth continues to decline in North Dakota
The hype on the US tight oil boom that could turn the country in a net oil exporter in the future is being mitigated by actual facts on the ground. Indeed, while crude oil production continues to increase, the growth is in fact declining, especially in (already) mature plays such as the Bakken shale in North Dakota. Crude oil production in North Dakota reached a new record high in April 2013 at 793’000 b/d, up 182’000 b/d y/y. However, production growth continues to slow down. At +182’000 b/d y/y, output growth is at the lowest level since November 2011.
A snow storm and extremely cold temperatures may have slowed down the development of new wells or forced some companies to halt wells during April and contributed to an increase of 50 to 490 in the number of wells waiting for completion. Wet weather in May could also have prevented activity from rebounding in North Dakota. Improved weather conditions in June could lead to a temporary rebound in crude oil production growth. Weather related events could only help explaining month on month fluctuations but have not contributed to the decline in crude oil production growth in North Dakota from +77.1% in May 2012 to 29.8% y/y in April 2013.
This decrease was caused by the lower amount of drilling rigs, due to lower oil prices and rising costs in the second part of 2012. This contributed to a lower amount of new producing wells that are required to offset the high decline rate at existing wells. According to the government of North Dakota, 90 wells need to be drilled every month only to offset the decline of production at existing wells.
This number may increase in the near future due to the decline in productivity growth and as the number of existing and declining wells are increasing. Indeed, the growth of crude oil production per well fell in April to +3.3% y/y, the lowest gain in productivity since May 2007. Despite improved drilling efficiency, companies are now drilling in less prolific areas, reducing productivity. While crude oil production in North Dakota could reach a new record high in June due to improved weather conditions, further decline in crude oil output growth is expected in the coming months unless the rigs count rebound.
Nickel has some upside potential, despite grim fundamentals
Nickel has largely underperformed the base metals complex in the past months; and prices tumbled to less than $13,700/tonne last week, following the Fed’s FOMC comments. Year-to-date, nickel is down 22%, while copper is down 16%, lead 14% and zinc 12% (these numbers take into account last week’s severe sell-off). From a year ago, nickel is also by far the worst performer, down 21%, even compared to aluminium, the other fundamentally weak metal, which is down by “only” 12%.
We are not surprised by this price disaster, as we have been negative on nickel for several months. However, prices appear now way too depressed, especially in regards to the marginal cost of production, which is estimated at circa $18,000/tonne – meaning that prices are currently 25% below it. In the past 30 years, nickel prices have regularly fallen far below marginal costs (down to 40-50%), so downside risks are not totally eliminated. We believe however that prices have more upside potential and should catch up with other base metals’ performances in the coming months, especially after the summer, when demand should pick up.
In addition, fundamentals could positively surprise in the coming months. Although the market is set to remain in surplus due to several projects that are coming online (including new capacity for nickel pig iron) and due to the slow recovery of stainless steel production, supply risks still persist. Most of the non-NPI nickel projects use the HPAL technology, often associated with delays and setbacks. In addition, consumers often switch refined nickel for NPI when prices of refined nickel are discouraging, which is obviously not the case at current levels.
Negative sentiment is increasing on grains
A few investment banks recently published bearish reports on grains, mainly corn and soybean. Indeed, many analysts downgraded longer term price forecast for corn and soybean futures due to expected record harvests in the US and a recovery of ending stocks. According to the last World Agricultural Supply and Demand Estimates (WASDE) report published this month, corn production should increase by 30% year on year to reach a record of 14 billion bushels and ending stocks are likely to be multiplied by 2.5 times. Soybean production will also set a new record at 3’390 million bushels with ending stocks up by more than 100%. Competition from South America and relative slowdown of the consumption will lead to higher ending stocks for corn and soybean. Therefore, analysts recommend initiating a short position in both markets with corn and soybean prices being significantly higher than prices in 2010, +27% and +22% respectively. The negative sentiment is reflected in net long speculative positions in corn futures, but not for soybean futures.
Managed money net long positions on the CBOT Corn futures could hence fall further despite being already under 100’000 (at 82’500), compared with last year high at 343’000 in August 2012 due to the significant drought. Net long speculative positions have declined sharply since last year. But oversold conditions are likely to appear only when the amount of net long speculative positions on corn futures fell below 50’000, like in June 2010 and in June 2012, which preceded significant corn price rally (+61% between mid-June 2010 and end October 2010 and +58% between mid-June 2012 and mid-August 2012).
The situation for corn contrasted with the soybean market where the amount of net long speculative positions on the CBOT Soybean futures remained relatively high at around 155’000 as South American crop, which account for about 55% of the global soybean crop, will only be planted in October. On the other hand, the US corn crop accounts for 37% of the global supply and planting has recently finished. Therefore, uncertainty remained important on the soybean market. This was also reflected in the recent outperformance of soybean over corn prices.
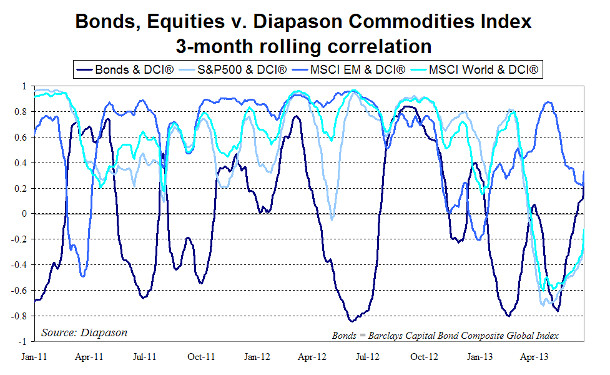
Chart of the week: Change in asset class correlations
|
Commodity correlations with other assets are weakening and even correlations between sectors in the commodities space have gone down significantly. In the coming months, we expect a more independent, diverse and differentiated commodity price performance with individual market supply and demand factors driving price movements. At the beginning of March this year, commodities correlation with the S&P500 and the MSCI World Index has been close to 1, but with the recent show of relative strength amplifying commodities newly-found dominance, the correlation approaches zero. Even among commodity sectors, the correlations are changing and those correlations are now showing more and more of the varying influence of the business cycle. |
|
|
For the full version of the Diapason Capital Markets report, please contact info@diapason-cm.com