
June 10, 2013
Reasons for the commodities’ revival: Sentiment, USD and China - Part 1
Commentary by Senior Market Strategist Robert Balan
«When everyone thinks alike, everyone is likely to be wrong. »
Humphrey B. Neill
Circumstances surrounding the stock market sell-off earlier last week provided an event that a lot of investors have not seen for some time, as major equity market averages fell over 1% across the board - and across the globe. The noteworthy item is not in what has happened, but rather in what has NOT happened -- commodities held their ground, and some commodities actually gained during that period.
What’s going on? Is this the start of a commodities revival? The resiliency showed by the commodities sector in the past few days, despite the equity market carnage, provides a glimmer of hope that the drought must be ending. Simply put, the commodities complex has been unloved, and washed-out but finally we may have seen signs of investors capitulation. The sentiment regarding commodities among institutional investors (funds and hedge funds) is now at the same lowest levels which were seen in the 2008 Great Credit Crisis, just before the market recovery. The aggregate large speculator net position from the Commitment of Traders report is also instructive — large speculators have liquidated their net long positions from a near crowded long level to net short. Moreover, readings are consistent with where declines have halted in the past. These are historic levels which have provided support — they may do so again this time.
There are other, and probably even more compelling, reasons for believing that a commodities revival is at hand. One of them is the decline in the US dollar -- the US currency has likely peaked several weeks ago and may have seen its top for the year.
Several factors are suggesting the US dollar will fall further during the year. For one, our multi-factor USD model has signified a peak -- this model has delivered better results in the past several years compared to most single factor models. For instance, conventional wisdom which says that the growth differential between the US and its major trading partners determines the direction of the US currency. This naive model is probably wrong at this juncture -- what matters is not the growth gap today but what it was on historic basis and what it will be over the next two to four quarters. The forex markets are now in the process of pricing in the diminishing probability of US outperformance as the UK, Canada, Japan and even Europe begin to grow again. A weaker US Dollar should translate into firmer commodities down the road, likely up to Q4 this year.
The other reason for our optimism is China — the country might be getting some lift from better financing data in the past few months, and NBS PMI internal components have been better than the headline. Total financing aggregate and new yuan loans have been higher than expected in the past two months. That makes a difference because these variables lead GDP and import data and industrial output by about three to four months. We expect a firmer tone to growth in China going into H2 2013, which should help lift commodities and other risk assets.
 |
Main drivers this week
|
Commodities and Economic Highlights
Commentary by Robert Balan, Alessandro Gelli, Marion Megel and Alban De Rougé
Despite higher crude oil exports, the US still requires heavy crude imports
The tight oil boom in the US has created a surplus of light sweet crude oil in the country, reducing the need for the country to import crude oil of such quality and increasing crude oil exports. The share of light sweet crude oil imports (with an API density of 35° or above) over total crude oil imports declined from 22.8 percent in 2010 to 14.7 percent in 2012 and reached in February 2013 9.9 percent, a record low. US imports of heavier crude oil isn’t likely to decline as fast as light sweet crude oil as modern refineries, especially on the Gulf Coast, are configured to handle heavy crude oil.
On the other hand, US crude oil exports have increased rapidly from 40’000 b/d in 2010 to 60’0000 b/d in 2012 and to 100’000 b/d in Q1 2013, accounting for about 13 percent of Canadian crude oil imports. All crude oil exports were sent to Canada. While exporting US crude oil is forbidden, the US government could nonetheless give permits to export crude oil to Canada.
US crude oil exports to Canada could increase further in the coming months, replacing other light sweet crude oil from the Atlantic Basin such as Brent, and West African crude oil.
Nonetheless, the US still require heavy crude oil for its modern refineries on the US Gulf Coast, which have been designed for this quality. In fact, the share of heavy crude oil (with an API density of less than 25°) increased more rapidly, while the medium-grades declined as refineries are now importing heavier crude oil to be blend with light domestic crude oil from tight oil fields (Eagle Ford Shale and Bakken Shale) that typically have an API density of around 40° or above.
PGMs supply risks resurgence: expect PGMs to outperform gold, silver
Production risks are rising in the South African mining sector as labour tensions have intensified and as the energy availability has tightened. These are adding further support to platinum and palladium, which are expected to outperform gold and silver in the coming months, due to their industrial profile, since markets appear to have returned to a risk-on mode.
Firstly, labour tensions have aggravated recently, especially since one person (allegedly a union member) was killed two weeks ago near Lonmin’s Marikana mine. Also, the Association of Mineworkers and Construction Union (AMCU) has threatened to call for a massive strike if it was not recognized as the majority union at the Marikana mine, where the union now represents 70% of mine workers. Furthermore, Impala announced that nearly 3,000 workers had downed tools at its Lease Area mine to support a dismissed colleague.
Secondly, the mining sector is also facing high risks of power outages as coal inventories have headed downwards due to a series of coal strikes in the first quarter this year. Recently, Eskom — the national electricity provider — reported that its reserve capacity (available capacity over the capacity needed to meet normal peak demand levels) was just 1%. This level is similar to that preceding the early 2008 blackouts, which have led to an annual increase in electricity tariffs of 25% on average since then. Tariffs are expected to rise by another 16% in 2013, and if the 2008 scenario was to be repeated, such supplementary cost pressures would significantly weigh on producers’ margins.
As platinum producers already announced production cuts and disinvestments after having released grim 2012 annual reports, further labour cost hikes and a higher-than-expected rise in electricity tariffs could be the last straw and could have a much bigger impact on production than expected at the start of this year. PGMs fundamentals are therefore expected to tighten further in 2013 and the metals to outperform gold and silver
Announced aluminium production cuts unlikely to materialise
Among base metals’ rally of the past weeks, aluminium was one of the strongest performers, after having remained depressed for several weeks. We are not surprised by this recovery as downside risks appeared limited for aluminium prior to the rally, which, to our opinion, hit a bottom at the beginning of May 2013 when prices fell 17% below the marginal production costs. In history, such a spread was often associated with a bottom in aluminium prices.
In addition to a technical recovery, it seems that aluminium prices improved as several producers announced their intention to curtail production due to extremely tight margins. The EBITDA margin of Alcoa for instance has collapsed from 14% at the beginning of 2011 to 7% in Q1 2013 and considering the average price in Q2 2013 so far, it could fell further to about 5% this quarter. This is therefore not a surprise that Rio Tinto announced its intention to dispose of aluminium assets and that Alcoa, Rusal and other major producers announced production cuts. In China also, approximately 1 million tonnes of production could be slashed this year, since approximately 20% of Chinese producers were indeed reporting negative margins with prices averaged in May 2013.
Despite all these efforts, it seems that a decrease in global aluminium production will not materialise this year. In China, the curtailments should indeed be more than offset by a production growth from the Western provinces where new production remains profitable. Year to date, China’s production is up 14% y/y. Outside China, production is rising in countries enjoying a competitive advantage with low energy costs, such as North America and the Gulf region (both regions showed a 4% y/y rise from January to April 2013).
In addition, we suspect that producers having announced capacity cuts may not honor their promises and could ramp up production as soon as margins recover. This is what has been happening in the past years: although Alcoa, Rusal and Norsk Hydro cut their capacity by a cumulative total of 5% from 2011 to 2012, the cumulative production from these three producers remained flat last year, as they actually increased their capacity run rates from an average of 85% to 90% after physical premiums rose.
Consequently, aluminium production should continue to rise faster than demand, despite the solid demand growth prospects, especially in the US and Chinese construction and transportation sectors.
Brazil is becoming the world’s largest corn exporter due to the Safrinha crop
After being a top soybean supplier, Brazil is becoming as well a major corn exporter. Indeed, according to the last USDA report, Brazil became the largest exporter for the season 2012-13, before US and Argentina. This progress was possible thanks to the Safrinha corn crop, which has doubled in the last two years. The term Safrinha, which means “little harvest” in Portuguese, was created decades ago when Brazilian farmers started planting a low amount of corn following an early soybean harvest. As farms modernised, more farmers were able to plant and harvest their soybean crops earlier, leaving time for a second crop. Therefore, Brazil's Safrinha crop surged from 3 million metric tons (Mt) during the season 1992-93 to more than 40 Mt this year. Since last year, it even became larger than Brazil's first corn crop.
This increase in second-crop corn plantings has matched a slowdown in the growth of first-crop corn production as farmers increasingly favours soybeans due to the impressive productivity in soybeans and the fact that growing soybeans is relatively less expensive than planting corn. However, the high price of corn seen recently has pushed farmers to plant corn after harvesting soybeans. Therefore Brazil, has emerged as the top corn supplier exporting 21.5 Mt, representing a market share of 24 percent. This has coincided with a steep decline in US market share from more than 50 percent a decade ago to 21 percent last year.
Regarding next season, 2013-14, the US should regain their top corn export ranking thanks to a better harvest. With a production estimated at 359 Mt and exports at 33 Mt, the US will be far ahead of Brazil, which should “only” export 18 Mt. However, Brazilian farmers will harvest a record Safrinha crop and incentive to offload a large portion of that new corn crop onto the export market will be strong.
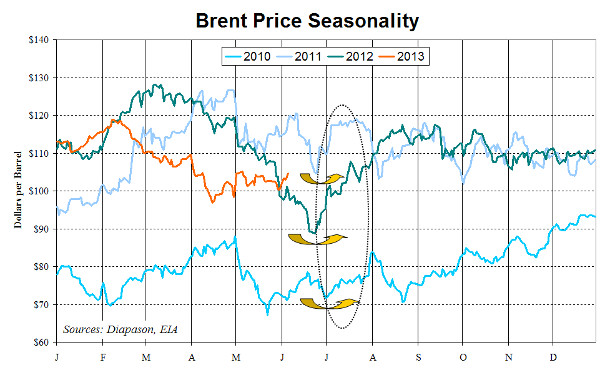
Chart of the week: The Brent’s seasonal weakness is about to end
|
Brent prices have recently recovered from the sharp April’s correction. It is interesting to see that the price decline in April mirrored the three previous years that also saw lower oil prices in April-May. The seasonal price pattern matches seasonal factors of the oil market. Indeed, April-May correspond to the peak in refining maintenance in Europe and in Asia (and the end of the maintenance season in most parts of the US) that reduces crude oil demand, pushing inventories higher. This has an important impact in Europe as Russian refineries are also performing maintenance work during this period, leading to higher Russian crude oil exports. As refineries are gradually restarting, Russian crude oil exports are expected to decline during the summer. Furthermore, petroleum products demand tends to decline as it corresponds to the end of the heating season (lower heating oil demand) and as the summer driving season has not yet started. Moreover, the recent increase in oil demand from the power sector in the Middle East and in Asia also pushed higher the seasonal pattern of oil demand as hydropower increases in April-May, while power demand is low, reducing oil demand from the power sector. However, during the summer power demand peaks boosting oil use by power plants. Finally, on the supply side, Brent benefited these past three years from important supply disruptions on the North Sea as offshore oilfields encountered difficulties in restarting output after having performed maintenance work, which are usually done during the summer due to weather conditions. Moreover, crude oil exports from Russia and Saudi Arabia tend to decline in July and August due to rising domestic demand and high refining activity. Therefore, stronger demand and lower crude oil supply amid growing geopolitical risks in the Middle East, could push oil prices higher during the summer. |
|
|
For the full version of the Diapason Capital Markets report, please contact info@diapason-cm.com