
June 3, 2013
Commodities underperformance: real rates are the culprits, not China
Commentary by Senior Market Strategist Robert Balan
“It all comes down to interest rates. As an investor, all you're doing is putting up a lump-sump payment for a future cash flow."
Ray Dalio
We investigated the causes of the commodity and gold underperformance in recent months, and what we found does not hew to the conventional wisdom. The latter suggests that the growth slowdown in China was the primary reason for the poor showing of the commodities and gold -- what we found is much more complex. It is really the rise of real interest rates which significantly and negatively impacted commodities and precious metals. However, the strengthening of the US Dollar, the weakening of EM activity as well as the relatively slow growth in China, and diminishing inflation expectations all contributed to the fact. It was like a perfect storm -- the convergence of all these factors during a period was too much for positive cyclical factors to counteract.
Commodity prices may also have fallen due to the spill-over effects between commodity and gold prices -- the sharp fall in gold prices may have contributed to lower prices of other commodities through association insofar as sensitivity to real rates are concerned (which impacts precious metals in an even more acute degree).
We also found that the relationship between real interest rates and commodity prices is dependent on the intensity of GDP growth, and so the net impact of the correlation varies according to the stage of the business cycle. Shocks that increase future commodity prices, such as higher economic growth, or higher payroll data may also lead to higher real interest rates. Thus, a positive relationship between real interest rates and commodity prices can emerge due to simultaneity bias, so the current negative relationship between real rates and commodity prices is not permanent -- it may change to positive as the business cycle accelerates higher, stoking growth and inflation expectations, which are positive for commodities.
An effective commodity tactical allocation program should therefore be based on the business cycle stages. The shift from low to higher real rates and vice versa is not random, and has a bearing on the prevailing stage of the business cycle. At the beginning of a business cycle, the rise in GDP growth is accompanied by rising nominal rates and falling inflation. That has been a characteristic feature of these three variables since post World War II. That feature holds true as well at the start of a half business cycle, coming from a so-called mid-cycle pause.
This of course makes a forecast inevitable at this juncture -- we believe that the business cycle from 2009 has just started a new half-cycle coming from a mid-cycle pause which bottomed in Q4 2012. We also believe that the real rates will top out in late Q2 - early Q3 2013, and will decline during the rest of the year and into the first half of 2014. That is when we believe that the whole business cycle which started in 2009, makes a trough. By extension, we see commodities performing much better as from late Q2-early Q3 2013, and will likely perform creditably going into year-end and even in early 2014.
 |
Main drivers this week
|
Commodities and Economic Highlights
Commentary by Robert Balan, Alessandro Gelli, Marion Megel and Alban De Rougé
Iraq: Crude oil exports growth unlikely to rebound soon
After the North America, Iraq is expected to be a major contributor to global crude oil supply growth in the coming years. However, the country is facing some difficulties in boosting crude oil supply. In May 2013, Iraqi crude oil exports were estimated at 2.6 million b/d, the same level than the previous month and close to October-November 2012 levels, implying that crude oil exports growth has slow down significantly. The latter fell from +400’000 b/d y/y in Q4 2012, to +290’000 b/d y/y in Q1 2013, and in April-May to +130’000 b/d y/y.
One of the reason behind lower crude oil exports growth is the dispute between the Kurdish Regional Government (KRG) and the central government in Baghdad about oil income that led to the partial halt of Kurdish crude oil production. Kurdish crude oil is typically exported with crude oil produced in the northern part of the country through the Kirkuk-Ceyhan pipeline. Recent attacks against this pipeline have also contributed to lower exports from the northern part of the country. Indeed, in April 2013, crude oil exports from Basrah reached 2.3 million b/d (+0.2 million b/d y/y), a new post-Saddam record, while crude oil exports from Kirkuk fell to 0.3 million b/d (-0.1 million b/d y/y), down 160’000 b/d from the high made in August 2011.
Thus, Iraqi crude oil exports could increase if an agreement is reached between Erbil and Baghdad. However, Kurdish authorities are backing a plan to build a pipeline to Turkey in order to bypass Baghdad’s controls over Kurdish crude oil exports. The pipeline is likely to exacerbate tensions between the KRG and the central government. On top of current difficulties, growing sectarian tensions have increased political instability and concerns about safety, discouraging investment in the oil industry. Iraqi crude oil exports growth is therefore unlikely to rebound anytime soon.
Cushing inventories to rise until the Brent-WTI spread widens
According to the US Energy Information Agency , the refining activity fell sharply in the US Midwest, while it tends to increase during this time of the year. Crude runs fell to 3.0 million b/d, 5.5 standard deviations below the 2004-2008 average, contrasting with high refining activity last year and at the beginning of the year. So what changed ?
Several factors have triggered lower refining activity. First, some refineries have performed more important maintenance work than normal after delaying it during two years in order to benefit from high margins. However, this cannot fully explain why crude runs continued to decline even after the end of the turnaround season. The fall in Brent-WTI spread to levels below $9 has reduced significantly margins for refiners in this region. In fact, this year the Brent-WTI spread followed closely the refining activity in the Midwest.
Moreover, the narrower Brent-WTI spread reduced the amount of crude oil transported from the Midwest to coastal regions amid growing crude oil production in the Midwest. These factors and lower refining activity pushed hence crude oil inventories higher in this region. It is interesting to see that despite the increase in infrastructure (rail, pipeline) to move crude oil out of the Midwest to coastal regions (encouraged by the wide Brent-WTI spreads these past 2 years), the share of crude oil inventories in the Midwest over total US crude oil inventories has risen from 25% in 2010, to 28% last year and now to about 30%. Indeed, media said that US crude oil inventories reached the highest level since the EIA began collecting data in 1978, but they failed to distinguish coastal regions and the Midwest, where crude oil inventories indeed increased to a new record high, while US ex-Midwest inventories stood between 2009 and last year level for the season. The Brent-WTI spread hence needs to widen in order to see a rebound in refining activity in the Midwest. Until then, crude oil inventories could increase further in the region.
China loves gold more than ever
China's demand for gold has never been greater. Since prices started to retract in February this year, and particularly since the mid-April sell-off that saw the precious metal suffering its greatest daily percentage drop in 30 years, bargain hunters have rushed on gold in China. The latest trade statistics show that in March 2013 already, mainland China’s imports from Hong Kong – a proxy for total gold imports, which remain undisclosed – more than doubled and hit an all time high of 223.52 metric tonnes, compared with 97.11 tonnes in February 2013.
According to both the China Gold Association and the World Gold Council, the trend accelerated in April and early May this year. Although no actual numbers have been released yet, April 2013 imports could have approached 200 tonnes too. The question is whether the momentum will be maintained in the coming months: it is likely that physical demand and imports will remain very strong in the coming weeks due to the relatively low prices but that the importing monthly pace of circa 200 tonnes will not be sustained.
The rest of Asia has also been reporting exceptional gold demand figures. The World Gold Council believes that the continent’s demand will reach a record high in Q2 2013 and that Indian imports could be between 350 and 400 tonnes in that quarter, tripling from a year earlier and nearly half of the country’s total 2012 imports.
Price risks for the new corn crop and spreads
According to recent USDA estimates, U.S. corn production this year will set a new record of 14.14 billion bushels thanks to a record yield of 158 bushels per acre, or a 28% increase since last year, which had been affected by the drought. With a consumption only up by 12%, ending stocks are estimated at 2 billion bushels. If realised, it will be the highest level since the season 2004-05 and will represents 15% of the use. Moreover, it will represent an increase of 164% year on year (y/y). Since 1960, there have only been three years prior to 2013-14 in which US corn ending stocks increased by more than 100% y/y: 1985-86, 1996-97, and 2004-05.
In two of those three years, the July/December spread tended to trade around average levels. However, in 1996, when ending stocks-to-use increased from 5.0% to 10.0% between 1995-96 and 1996-97, the July/December spread reached $1.59/bu in May 1996. Even though 2012-13 US corn stocks are tight at 6.8%, they will not be as tight as in 1995-96. Therefore, the July/December 2013 spread, which was traded at around $0.97 last Friday, is unlikely to reach the highest level seen in analogous year. The major risk for compression of the spread is weather as recent rains have led to a 7% increase in December 2013 CBOT corn futures prices between May 21 and May 29 versus a 4% increase in July 13 CBOT corn futures prices.
In recent days, heavy rains in parts of the Corn Belt and the forecasts for additional rain and flooding have raised the probability for spread compression. In the near term, such weather headlines are likely to take precedence over the tight domestic market in the US. These weather issues are also observable in the USDA Crop Progress report. Indeed, during the week ending on the 26th of May, only 15% of corn has been planted, which is far from the 43% recorded the week before.
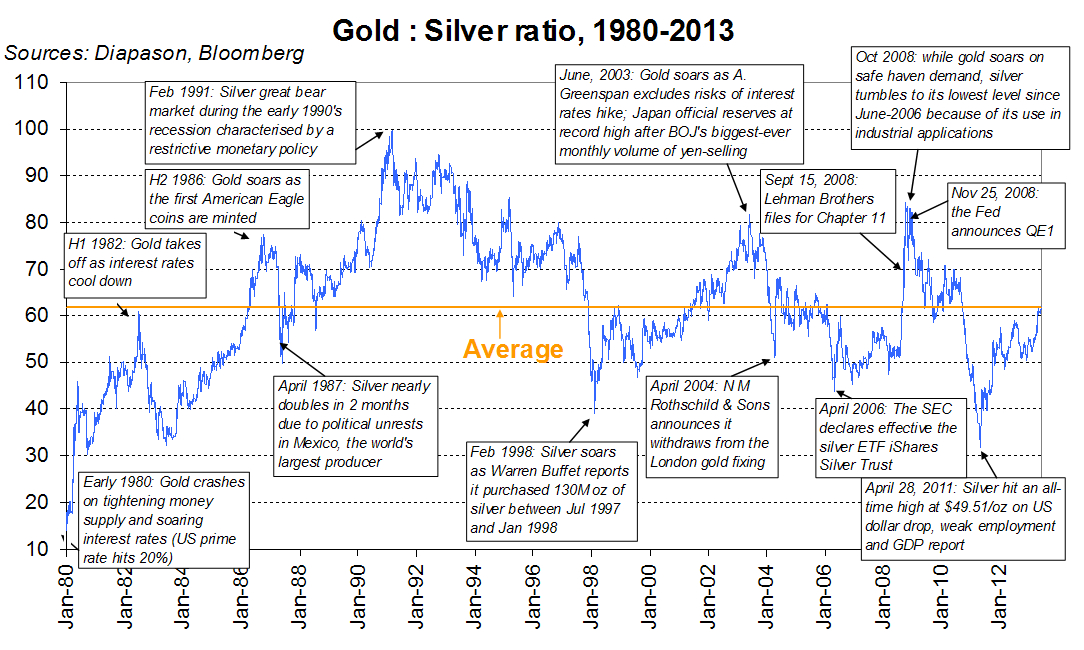
Chart of the week: The Gold : Silver ratio could climb higher this year
|
The gold to silver ratio has experienced some erratic movements in the past two years. Since it hit a 31-year low in April 2011 to 31.7, the ratio has steadily climbed, to reach 62.5 last week, just above its long term 1980-2013 average. This ascent means that silver has strongly underperformed gold in the past months. We expect that this underperformance will continue this year and that his ratio could actually escalate up to circa 80, a level not so uncommon in the 1990’s, but only hit in two distinct periods since the start of the century. Silver’s underperformance finds its roots in supply and demand fundamentals, which continue to drive silver prices to a greater extent than gold prices. The industrial demand should indeed decelerate in the coming months, due to a crisis in the photovoltaic industry, which has been the strongest contributor to silver industrial demand since 2007. The sector is indeed suffering from a large global overcapacity and from lowering public subsidies to producers, especially in Europe. On the other hand, investment demand should remain insufficient to offset the slowdown in the industrial use: retail investors should keep their silver interests in the form of coins and ETFs more or less steady, but institutional sales should continue to liquidate their silver positions to return to risk-on strategies. In addition, jewellery demand should also be pale as consumers could use the drop in gold prices to purchase gold jewels whose prices were inaccessible just a few months ago. On the supply-side, mine production should strongly increase this year, despite the grim demand picture. As 70% of the devil’s metal mine production comes as a by-product, the supply of the precious metal is highly inelastic and should soar in the next 2-3 years as new copper, gold, lead and zinc deposit come online. Silver is therefore expected to exhibit a significant surplus, and consequently to continue to underperform gold this year. |
|
|
For the full version of the Diapason Capital Markets report, please contact info@diapason-cm.com