
April 29, 2013
The aftermath of April's panic: Loose monetary policy and higher growth
Commentary by Senior Market Strategist Robert Balan
"There are two main drivers of asset class returns - inflation and growth”
Ray Dalio
It has been like another sequel to a particularly bad horror movie but is almost over, and has not been the surprise or the scare that had characterized its prequel episodes. Like we said in last week's report, we have seen this before. So the pattern of the previous three years has repeated. And investors begin to fear the worst scenario, extrapolating their fears into extremely unlikely outcomes. Well, the big sell-off has not happened this time around, or if it did, it showed up only in the EM assets and in cyclical commodities and gold. What was the difference, or what made the difference this time around?
The difference was the slowdown was not unexpected. Economists have been warning about it for at least a quarter. The proximate cause is of course the biggest federal-budget tightening in the US in more than 60 years. So the US economy -- and global investors -- were better prepared to deal with the March, April slowdown. This should not come as a surprise: the tightening of the US federal budget is not coming as a shock or a surprise. Households and businesses have prepared for it, and even government employees affected by sequestration have basically known for some time that there will be furloughs.
In many sense, the slippery patch in March will prove to be a blessing in disguise. Talks about the Fed winding down QE3 by H2 2013 have been quashed. The European Central Bank (ECB) is also now expected to cut rates during May, as slower US data in March makes it less likely that activity in the eurozone will also improve in the short-term. Even the Bank of Japan has been mulling another round of easing after the late-in-the-quarter weakness in US data.
So how do you deal with this sequel? I suggest we deal with it rationally -- for one, the issues are more mundane now than in the prequels. There is not anymore an existential risk for the eurozone -- the talks about a eurozone implosion are gone. A US government paralysis due to budgetary gridlock, while not yet a zero-chance event, is looking more and more unlikely.
That and the fact that the US economy is now in a better condition to weather any fiscal fallout (thanks to a robust housing market and reasonable consumer consumption), suggest to us that growth and asset prices could surprise to the upside from here. Commodities that have underperformed other risk assets offer now value on both absolute and relative basis.
 |
Main drivers this week
|
Commodities and Economic Highlights
Commentary by Robert Balan, Alessandro Gelli, Marion Megel and Alban De Rougé
Aluminium production rises further in regions with a cost-competitive advantage
Although aluminium prices have been depressed for several months and are currently traded about 13% below their production costs, the lack of supply discipline should persist and globally maintain the grey metal’s fundamentals in a significant surplus this year. First and foremost, China’s succession of record production levels in the past months, driven by governmental subsidies on power prices, has strongly swollen supply levels since 2010.
But China has not been the only producing region to ramp up output. Although production cuts were announced around the world in late 2011, some producing regions with a competitive cost advantage have started to resume production recently. In particular, regions with lower energy costs have been very competitive, as power accounts for about 40% of the aluminium production costs in average.
North America, after having enjoyed low gas prices last year, are now benefiting from lower coal prices, allowing them to report in March 2013 their highest daily production volume since January 2009. Similarly, the gulf region, which enjoys low and subsidised energy tariffs, has posted a record-high aluminium production figure last month, at 10,600 tonnes per day, and has now become an important producer of the metal. Indeed, back in 2010, Gulf countries’ production was only half of that of North America; and is now just 25% below the US and Canada combined volumes.
The market overestimated the impact of the bumper sugar crop in Brazil
International sugar prices recently suffered from expectations of bumper crop in Brazil. Sugar cane output in the centre-south region, which comprised for about 90% of Brazilian sugar cane output, could reach 594 million tonnes, a record level, up from 533 million tonnes last year. However, this does not necessarily translate into higher white sugar exports as the Brazilian ethanol industry tends to absorb about half of the sugar cane output.
This year ethanol production is expected to be especially strong thanks to tax-breaks and extended low-cost credit for the ethanol industry and the higher ethanol content into gasoline. The Brazilian government announced that the amount of ethanol in gasoline will be raised as of May 1st 2013 to 25% up from 20%. The blend was cut to 20% in October 2011, after concerns over the drop in ethanol supplies due to drought and poor cane yields would contribute to higher fuel prices, while the government was fighting inflation.
This year, ethanol demand from “flex-fuel” cars, which can run on ethanol, oil or a mixture of the two is expected to increase. Last year, gasoline demand rose at the expense of ethanol as gasoline prices were capped by the government, while ethanol prices rose. In January 2013, the Brazilian government increased gasoline prices in order to encouraged ethanol demand.
Stronger ethanol production and demand would hence absorb incremental sugar cane output, limiting the impact of the Brazilian bumper sugar cane crop on international sugar prices. Thus the market may have overestimated the impact of the Brazilian crop on global sugar supplies.
Infrastructure constraints are mitigating the rebound in Brazilian soybean crop
After the disappointed soybean production last year, South America should produce a record harvest this spring at 149 million tonnes (Mt) according to the last numbers available from the USDA. Indeed, the 2011-2012 season was impacted by one of the most important drought due to the climate phenomena called La Nina. Consequently, yield in Brazil, Argentina and Paraguay, the three biggest producers in South America, fell heavily: -15% in Brazil and Argentina and -37% in Paraguay.
However, climate has been friendly this season, leading to a recovery in the yield and production. According to the USDA, Brazil should harvest a record of 83.5 Mt, up by 25% since last year. 27.5 million hectares (Mha) have been dedicated to grow soybeans which is the largest area used on record. Since 2006, this area has been increased by 33%. Moreover, yield will be the second highest on record at 3 tonnes/hectare (t/h). It is slightly below the record of 3.1 t/h achieved in 2011 but it still represents a rise of 14% y/y.
The same observation can be made in Argentina. A record area has been used and production should reach 51.5 Mt, the second highest harvest ever recorded. It is 4 Mt below the record obtained during the season 2009-10, but 28% more than last year. However, yield would be average this year (2.7 t/h), because of floods delaying the planting season and more warm temperature than normal during the growing stages of production.
The issue that South America is facing now is exporting soybeans. Brazil is impacted by logistical issue. The infrastructure bottleneck in Brazil has moved back from the ports to the in-country logistics with recent law changes. The drastic reduction in allowable truck driving hours has squeezed the internal transport market and has caused rates to increase by 25-50%.
Thus, despite record soybean production, the infrastructure bottleneck could mitigate the impact of the record crop on the international soybean market.
Late planting in the US could lead to lower crop yield
According to the last US Department of Agriculture Crop Progress report published on Tuesday, US farmers had planted only 4 percent of their corn by April 21. It is 12 points behind the proportion usually sown and 22 points behind last year level when warm and dry conditions in the Corn Belt make the job easier. The weak pace is due to the wet and cold weather during this winter. In some areas, temperature is 15 degrees Fahrenheit below normal.
In Illinois, the second largest producing state, only 1 percent of corn is planted, far behind the average of 24 percent. Worst, no corn was planted in Iowa, the top corn-producing state. However the rain and snow last week were well appreciated for replenish soil moisture in a state still impacted by last year drought. This slow start is also observable in other spring crops such as cotton and rice, in which the sowing pace lagged historical averages. 33 percent of rice was planted as of Sunday, compared to 65 percent last season. Even winter wheat development is delayed. 8 percent of the wheat was headed, which is 34 points behind last year level. This delay has some consequences on the quality of the crop. Only 35 percent of the wheat is rated “good” or “excellent” by the USDA which is far from the 63 percent observed last year.
Based on agronomic research on the relationship between planting date and corn yields, we observed a yield penalty associated with late planting. According to the University of Illinois, there have been 10 years since 1990, impacted by late plantings. On these 10 years, the US average yield was below trend in 5 years, about equal to trend in two years, and above trend in three years. Thus, this year late planting increases the chances of lower than normal yield.
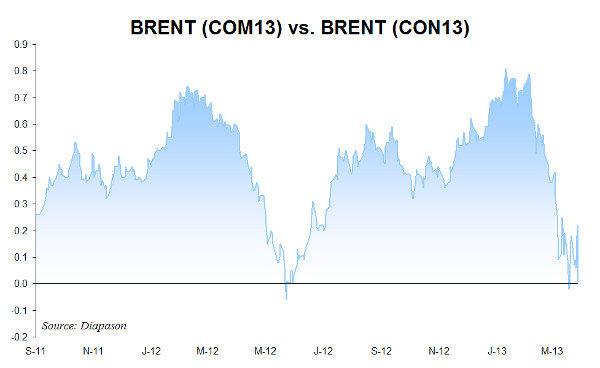
Chart of the week: Brent backwardation could widen on summer maintenance and higher refining activity
|
The Brent forward curve fell temporarily in contango in April due to stronger output in the North Sea (especially on the UK side), while refineries were performing maintenance work. Furthermore, stronger crude oil production in the US, reduced the need to import light sweet crude oil. Nigerian crude oil exports to the US fell to 100’000 b/d in January 2013, the lowest level since 1994 and down by 60% y/y, increasing light sweet oil supplies in the Atlantic Basin. This had recently had more important impact due to the refining maintenance season in the US that reduce further the need for imported crude oil. Other factors such as expected lower South Korean purchases of crude oil from the North Sea and new contracts changing the price mechanism of Brent added downside pressure on the front month relative to other maturities. However, the forward curve may have reached a bottom and, like last year, the backwardation could widen in the coming weeks due to higher refining activity and because of the incoming start of the maintenance season for offshore fields in the North Sea. Oil and gas companies tend to perform maintenance work during May to September because of the lower amount of storm during this period. For example, oil production from the Ekofisk stream in the North Sea is expected to be reduced by 165’000 b/d in June 2013 due to a shutdown of the Norpipe gas pipeline. Moreover, it is not the planned maintenance work that has a major impact on oil prices but the failure to restart halted facilities. Indeed, offshore fields are complex and companies find often difficult to restart a field, leading to larger than expected decline in output. Higher risks of supply disruptions amid higher refining activity that is encouraged by relatively strong margins should hence add upside pressure on the Brent’s backwardation.
|
|
|
For the full version of the Diapason Capital Markets report, please contact info@diapason-cm.com