
April 15, 2013
Chinese economic growth slows down, for now...
Commentary by Senior Market Strategist Robert Balan
Q1 2013 GDP growth slowed to 7.7% y/y from 7.9% in Q4 2012 -- should we start panicking? Before anyone does, let's dissect the data. The 7.7% GDP out-turn is lower than the consensus of 8.0% -- but it is still higher than the 7.4% posted in Q3 and the 7.6% reached in Q2, both last year. The government is likely comfortable with growth at the current pace. Support for this theme comes from the National Bureau of Statistics (NBS) comments that came along with the data that the “labour market has remained stable in Q1” and that “good progress in rebalancing and upgrading initiatives is being observed at the provincial level”. Previous government statements suggests that the lowest growth threshold for the new Chinese government is 7.5% -- with the Q1 2013 data coming out at 7.7%, it suggests to us that the current “neutral” monetary policy stance will be leaning towards becoming more accommodative during the rest of H1 2013. Therefore, we expect Q2 2013 GDP range to be at 7.5% - 8.0%.
There are some peculiarities in the Chinese GDP calculations that needed to be understood by Western-trained economists. Chinese real GDP is calculated by the production, rather than expenditure, method. That means that the metric leans heavily towards industrial production (IP). The reality is that IP accounts for about 40% of GDP. With this weight in the metrics, IP (itself very volatile) can make or break GDP projections. So let's look at Chinese IP performance in recent months. IP growth fell to 8.9% y/y from 9.9% in Jan-Feb (consensus: 10.1%); this brought Q1 2013 growth 9.5%, lower than the 10% in Q4 2012 (Q3 IP was 9.1%, Q2, 9.5%, and Q1 at 11.6%). The surprising slowdown in growth suggests that despite some visible restocking of raw materials in Q4 2012, the slower pickup in final demand was not strong enough to support a visible follow-up in inventory restocking among downstream industries. This also implies that industry overcapacity continues to weigh on upstream industries and restocking needs. Production of steel and cement declined in Q1 2013 -- that was predicted by the previous slowdown in investment growth. But the new emphasis on railway infrastructure by the new government will come to the rescue of this sector before long -- China's investment in railway infrastructure rose 28 percent to 54.51 billion yuan (8.65 billion U.S. dollars) in the first three months of the year, the official Xinhua reported last week, quoting news from the China Railway Corporation (CRC). Data provided by the CRC projects investment of a total of 520 billion yuan in railway infrastructure this year, and 5,200 km of new lines will be put into use. Moreover, IP output of state-owned enterprises (SOEs) grew 5.2% y/y in Q1 2013, which is only half of the 11.3% growth posted by ‘shareholding’ companies ("private" enterprises). The SOEs' slowdown in IP output, was the biggest single factor in bringing down the Q1 2013 GDP below market expectations.
There are other reasons for the growth slowdown. The new government has moved ahead with anti-corruption and anti-waste campaigns, which already have slowed, and will unavoidably slow consumption further in the near term. There are anecdotal evidence of slowdown in restaurant spending, decline in sales of high-end liquor (local and imported). Furthermore, part of funds allocated to social housing have been diverted to railways and water-projects (dams) instead, changing the make-up of metal imports from base metals (copper) in favor of ferrous metals (steel). However, we are confident that building social housing will become a top priority later in the year, as there is little traction for the oft-stated desire to urbanize China without building social housing in a greater sacle than what has been done in the past years. Finally, the new leaders seem to be tolerating a near-term slowdown to implement medium-term structural changes. They appear to accept the immediate pain of lower growth so as to develop new growth drivers through institutional and economic reforms.
The current monetary and financial conditions, by any definition, is accomodative -- this will likely continue for the rest of H1 2013. We project even more benign financial conditions in H2 2013, when we expect the new government to start a more aggressive growth platform. Job creation is not a concern in China, but some fragility in the banking/financial systems and corporate balance sheets demand relatively faster growth rates to stabilize the financial sector's condition. We expect this theme to add to growth imperatives later in the year. The current benign macro environment obviates any significant tightening of monetary and financing conditions -- a tighter stance is likely neither warranted nor desired by the authorities. The surge in new yuan loans and total social financing (TSF) will likely be met with more rigorous regulations to slow the pace, but the PBoC will likely focus its efforts on systemic risks and protecting depositors from shadow banking enterprises which have been instrumental in pushing up TSF aggregates. As export growth outpaced import growth, net exports posted a significant contribution of 1.1pp (14.2%) to Q1 2013 growth.
We expect that trend to continue over the next quarters. China's Q1 2013 GDP by expenditure component shows that consumption contributed 4.3pp (55.5%) and capital formation 2.3pp (30.3%). The growth paradigm in China is starting to change to a consumption-based model, and so we see the current slow-down in GDP not as a harbinger of impending disaster, but the inevitable pains that accompany any large-scale systemic change-over. We expect the rest of H1 to echoe these change-over pains, but H2 2013 should be a period of recovery and faster growth for China, which should have a positive impact on commodity markets.
 |
Main drivers this week
|
Commodities and Economic Highlights
Commentary by Robert Balan, Alessandro Gelli, Marion Megel and Alban De Rougé
Stronger OECD economic activity will contribute to commodity demand
The OECD's composite leading indicators (CLIs) point to stronger growth in most of the world's major economies. For the US and Japan, February's CLIs point to an increasing rate of output growth. In Europe, growth in the Eurozone is “picking up”, after the CLIs fell below trend in the second half of 2012. For Germany the rebound in the growth outlook is particularly marked, while for Italy there is a “positive change” in the outlook. For France, the CLIs suggest that there will be no further decline in the rate of growth. Outside the Eurozone, the UK's CLIs remained stable month on month, suggesting continued growth at around the longterm trend.
The recovery of the economic activity in OECD countries will have a positive impact on commodities demand. For example, last year OECD North America and Europe saw their oil consumption declined by around 0.8 million b/d y/y, due to the recessionary environment in Europe and weak economic growth in the US. Improved economic activity is likely to lead to a lower decline in oil demand in these two regions to about 0.3 million b/d y/y for 2013, while global oil demand growth could increase by 1.1 million b/d y/y.
Norwegian oil production could dissapoint more
In March 2013, Norwegian oil output (comprised of crude oil, condensate and NGLs) fell to 1.79 million b/d, down 0.26 million b/d y/y (-12.9 percent y/y). The bulk of the decline occurred on the crude oil, which fell to 1.43 million b/d, down 0.19 million b/d y/y, missing the output target by 60’000 b/d. During the first quarter, the target was missed by 80’000 b/d, due to technical problems at several offshore fields.
Disappointing output are appearing while record-high investment are expected this year, due to high oil prices. However, most of the investments are required just to maintain production at existing fields because of the high decline rate. Difficulties are likely to persist and could increase during the summer maintenance season for offshore fields in the North Sea (due to the lower amount of storm). Maintenance work tends to increase the risk of supply disruptions. Last year, the difference between targeted and actual production was high during the summer and at the end of the year as companies had problems restarting some fields after having performed maintenance work amid ongoing decline at existing fields.
Weak oil output in March had a marginal impact on crude oil prices due as production rose at some UK offshore fields and especially because of the refining maintenance season that reduces the demand for crude oil. As refineries are restarting activity in Europe, any supply disruptions would have a larger impact on Brent prices.
US corn inventories: despite upward revision, they remained at a 18-year low
US corn ending stocks have been revised higher as anticipated to 757 million bushels (Mb) or a 20% increase since the last USDA monthly report. It is the highest level forecasted since the July 2012 report. However, if realized, it would still be the second lowest level since 1975 and the lowest since 1995.
USDA reduced the use of corn by 125 Mb, including 100 Mb in feeding use and 25 Mb in exports. Industrials succeeded to reduce their consumption in front of the weak harvest of last year. However, the average trade guess regarding the ending stocks was 100 Mb higher at 850 Mb.
Corn fundamentals remained also tight in the global market, despite upward revision of corn output expectations. Global corn production was increased by 1.5 Mt for both the European Union and the Brazil. This would represent the largest harvest in Brazil reaching 74 Mt. Combined with a lower demand coming from the US, global ending stocks would come at 125 Mt, 8 Mt higher than the previous forecast made in March.
However, it still represents the lowest level in the past 5 years. The corn market remains hence vulnerable to a supply shock such as the drought that hit the US last summer. The recent correction of corn prices thus appears overdone but considering strong fundamentals further price downside remains limited. Furthermore, it provides interesting entry points for long only investor.
SHFE Copper back in backwardation, supporting the destocking activity in China
The forward curve of copper traded on the Shanghai Futures Exchange has retrieved its backwardation since mid-March 2013, for the first time since October 2012. As of April 12th 2013, the cash to 3-month spread stood at CNY100/tonne.
Such a price structure is generally unfavourable to stockpiling strategies, as the negative difference between the two contracts does not allow cash and carry strategies, which enable a trader to hold simultaneously a long position on the spot market and a short one on the futures market, using the spread between the two contracts to pay for the storage costs.
This, added to a pick up in industrial demand in China should lead to an imminent destocking activity in the world’s largest copper consumer; which has already started to materialize as inventories held in bonded warehouse have strongly diminished since February 2013 and could stand now at about 650,000 tonnes, far below the nearly 1 million tonnes reported at the end of last year.
A decline in SHFE inventories should soon follow, as maybe already evidenced by the 8% drop in these inventories in the past two weeks. Some of the decline (both at bonded and SHFE warehouses) has come from a shift of material towards LME facilities, where a contango can still be enjoyed; and some has resulted from improvements in industrial demand. In both cases, China has probably entered a destocking phase.
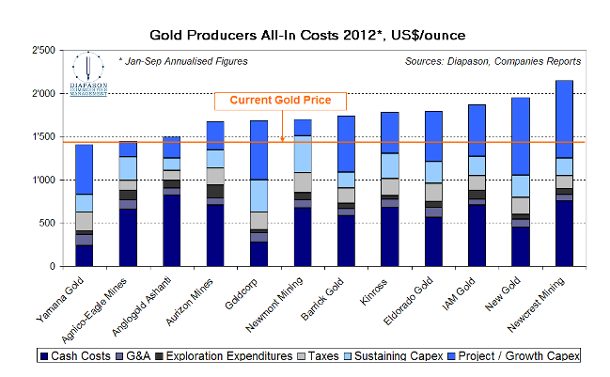
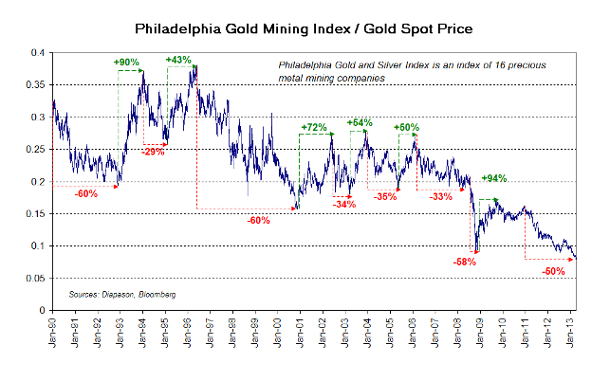
Chart of the week: This is why gold bulls should favour the metal gold over gold equities
|
Gold prices have collapsed since Friday last week, below the $1,400/oz barrier, to their lowest level since mid-2011. Before this sudden crash, the gold market was already on a downward trend since Q4 2012; and amid this downturn, gold equities have been more affected than the yellow metal. The Philadelphia Mining Index, an index of 16 precious metal mining companies, has indeed lost 44% of its value since mid-October 2012, while the gold price has “just” fallen by 15% over the same period. In particular, on Friday last week, the Philadelphia Mining Index tumbled by 15% while the gold metal dropped by “only” 5% (before dropping by another 8% yesterday). Gold equities’ underperformance is actually nothing new as the equities/gold price ratio has almost constantly been collapsing since 2006, when it stood as high as 0.27— compared with 0.071 now. The current depressed state of gold equities has prompted many investors to anticipate better returns in gold stocks than in the underlying precious metal. We believe this strategy might not be the best, as there is a clear reason to gold equities’ long underperformance: the heavy total production costs and some disappointing investment decisions. In the past years, gold producers have often displayed healthy margins in their financial reports, by disregarding some heavy expenses including the growth and sustaining Capex, the general and administrative expenses, the exploration expenditures and the taxes. This long-used profitability measure of “cash cost” has however become flawed as the Capex have skyrocketed in the past years, making the simple notion of margin - or even net income-, completely insufficient to draw the big picture of the global gold sector. In fact, by adding all the costs and expenditures, the all-in costs per ounce of the 12 major gold producers often doubled the sole notion of “cash costs” last year, and often exceeded $1,550/oz; meaning that gold producers really need much higher gold prices to keep on with their actual growth projects and deliver actual shareholder wealth. Consequently, only a considerable surge in gold prices could really benefit producers' equtiies; whereas investors could take advantage of a moderate rise in the metal’s price by investing directly on it.
|
|
|
For the full version of the Diapason Capital Markets report, please contact info@diapason-cm.com