
March 18, 2013
The US Dollar nears a significant top soon
Commentary by Senior Market Strategist Robert Balan
Recently, there has been a significant volume of media articles speculating that the US Dollar is due for further declines. The most significant point advanced for this postulate is the extension of the Fed's QE3 program, which now includes $85bln a month purchases of Treasury bonds in the open market. The other point is that inflation in the US remains tame, and hence, it does not deter the Fed from carrying out its stated goals.
We, too, consider that, after the recent rally, the US Dollar may be approaching an inflection point sometime soon, and should thereafter resume the decline. However, our reasoning diverges from the postulations stated above, and instead we have focused on the internal dynamics of the US currency to reach that conclusion.
1 - The US Dollar Risk premium:
When the U.S. dollar funding liquidity is high (the repos and CPs outstanding is growing), the risk appetite of dollar-funded intermediaries is high and their required compensation for holding risky assets is low. In particular, their risk premia on risky holdings of foreign currency are low, which lowers their risk threshold for buying foreign currencies (thereby selling the US Dollar). The less risk-averse these intermediaries are, the stronger their tendency to buy foreign currencies. Based on the work from the Federal Reserve, it appears that the changes in the growth of repos and CPs have good predictive power on the changes in the US traded-weighted index (USD TWI).
2 - The differential of global GDP vs. US GDP growth (GDP delta)
It is counterintuitive, but nonetheless provable, that the evolution of the US dollar exchange rate is more dependent on the changes in global growth than on the changes of the US economic growth. Indeed, the U.S. dollar tends to depreciate when the U.S. dollar interest rate is low relative to the foreign interest rate. Invariably, the average global interest rate will be higher when the global growth rate is higher. Hence, the US dollar tends to weaken relative to other currencies when global growth is higher relative to the US situation, and vice versa. Also, a higher global growth encourages capital outflows from the US in the search for higher yield.
The key take-away: the USD delta has grown last year despite relatively strong performance by the USD -- that signaled a future turn for the worse. The likely case is that the delta will keep rising this year, suggesting that a latent USD weakness is not over yet. We also expect a call for further USD declines from this metric.
Finally, our US Dollar model, based on the interaction of interest rates and inflation in the US, is also signaling an imminent turn in the US Dollar TWI.
 |
Main drivers this week
|
Commodities and Economic Highlights
Commentary by Robert Balan, Alessandro Gelli, Marion Megel and Alban De Rougé
Global auto production is set to expand by 5% in Q1 2013
Auto production data implies that global auto production in February fell slightly compared with the robust 6% gain (SA) set in January output; this, seasonally adjusted production for Q1 2013 to date is on a strong footing in relation to Q4 2012. The dip in February is likely to have arisen as a result of weakness in several countries, including the US (based on industry schedules), China and Brazil. That said, production in Germany increased for the second consecutive month in February, supporting the market view that German GDP will expand during H1 2013. However, the German trend improvement is likely to still overstate the situation at the euro area level (though data for other euro area countries are not generally available for the first two months of the year). In Japan, the Ministry of Economy, Trade and Ind. Survey suggests that Japanese auto production will have risen significantly further in February, by about 5.5% (although in March, the auto production forecast index is for a drop of 3.3%).
Since the general, global auto production trend up to January had been of increase, then if it is assumed that the March level of output is in line with the Jan-Feb. average, global auto production is on course to have risen by circa 5% in Q1 2013 (not annualized). This would be the strongest quarterly gain since Q3 2011, versus contradictions the two previous quarters and only soft expansion in Q2 2012.
Can crude oil prices reach $150-$270 by 2020
A recent OECD research recently forecasted that crude oil price could reach a $150-$270/bbl range by the end of the decade. Their analysis is based a return of global growth at a slightly below pre-crisis rate. The OECD expects global oil demand continues to rise despite higher oil prices as demand is inelastic to prices in the short run and because of the ongoing economic development in emerging countries. These countries contribute for the all the growth in oil demand, while OECD oil demand should remain flat as efficiency gains offset economic growth. In non-OECD countries, the decline in oil intensity (the volume of oil consumed for each dollar of GDP) only mitigates rising living of standards and demographics. Projected average annual change in oil demand over the period 2011-2020 is 1.6 million b/d, compared with 0.9 million b/d in 2012. China and India are expected to account for about half of global oil demand growth through 2020.
On the supply side, rising oil prices would trigger an increase in oil supply. Nonetheless, new supplies are required note only to respond to the growth in demand but also to replace the decline of current producing oil fields. High oil prices would also be required to encourage investment in new fields, improvements in extractions methods and technological innovations amid rising production costs both for new and current oil fields. Despite hte shale gas boom in the US, the OECD estimates that the potential for large-scale substitution of gas for oil seem limited in the near term.
While a high degree of uncertainty remain on future oil prices, this research points out that the oil market has still strong underlying structural fundamentals for both demand and supply. These factors have contributed to the rise in oil prices in the decade to 2010 and remain valid for the coming years.
Aluminium still jeopardized by production and inventory risks
Aluminium has been the ugly duckling of the base metals complex since the start of the bull market in 2002; and is expected to remain so this year. In fact, the light metal has just increased by 50% in the past decade, while other metal prices have been multiplied, by as much as 6 times for tin, 5.3 for copper or 4 for lead. This year, aluminium should advance alongside the all sector – triggered by an expected rise in China’s industrial demand – but should continue to lag behind, due to persisting production and inventory risks.
The aluminium market has been characterized by a lack of supply discipline since 2009, both from Chinese and non-Chinese producers. The situation is not expected to reverse, as margins could improve this year. Aluminium prices have remained below the marginal cost of production, estimated at about $2,200/t, for more than 18 months now (currently, they are about $200/t below); but this situation could change, providing smelters with better margins and thus higher production incentives.
In the past, theoretical negative margins have occurred in three different periods since the 1980’s, but just one was longer than 18 months: it indeed lasted for 3 years from 1991 to 1994, for 18 months in 2008-2009 and for 12 months in 2010-2011. If history is to be repeated, prices could soon move beyond marginal costs: as said above, prices are expected to improve this year for all base metals including aluminium, and on the other hand, production costs are decreasing in some producing regions due to the lower gas prices (electricity represents between 30% and 40% of production costs). This should discourage producers to curtail supply, even though this is what the oversupplied market currently needs.
In addition, inventory risks also persist: the +5M tonnes of aluminum that have been stockpiled in LME warehouses since 2009 could be steadily released to the market, if the contango continues to lessen. The contango usually drives storage strategies as it diminishes the storage costs. However, the contango is currently half its 2012 average, meaning that stockpiling has become less attractive to physical traders.
The ICAC hardens the ideal of a drop in world cotton stocks
The International Cotton Advisory Committee (ICAC) forecasts a decrease in world cotton inventories next season by more than 1.2M tonnes over 2013-14 to close the season at 15.8Mt (72.4M bales), contradicting the USDA expectations that world stocks would keep rising in the next season, to 81.1M bales (17.7M tonnes).
The Washington-based ICAC foresees a slowdown in the "ferocious rate" of stock building in China, which, during its annual strategy briefing, has placed as top priority ensuring the security of supplies of grain and major farm products. With a stocks-to-use ratio of 0.97, domestic cotton consumption is almost secured, an indication that the cotton reserve build-up could slow down in the coming months, with imports seen slowing nearly to 3M tonnes next season - well under half the 5.3M tonnes reached in 2011-12.
Nor will inventories swell in the rest of world as China holds back, with the ICAC, forecasting a 14% drop in world production y/y to a 4-year low of 22.6Mt. Stocks in countries excluding China will fall to some 7.7M tonnes, equivalent to 48% of use, also a 4-year low. With inventories in China unavailable to the rest of the world, the stocks to demand ratio in other countries is seen as a key indicator of price prospects, although the ICAC stopped short of making price forecasts.
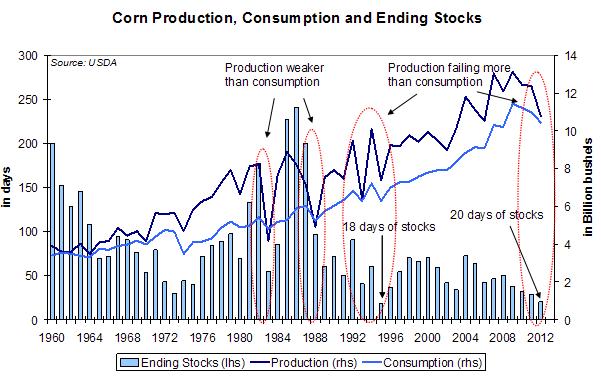
Chart of the week: Low level of corn inventories expeted next year
|
Last summer, corn prices jumped from $6/bushel to $8/bushel, as the U.S. experienced the worst drought in the last 50 years. Since then, prices have slightly decreased but are trading in a high range of $7-$7.5. The reason is that the drought has still some impacts. Indeed, in December, more than 60 percent of the U.S. was classified at least under the category “moderate” drought. The U.S. High Plains, which include key farm states of Nebraska, South Dakota, and Kansas, were the hardest hit. In that region, nearly 60 percent of the land area was in “extreme” or “exceptional” drought, the two worst categories of drought. Corn ending stocks are forecasted by the USDA at 632 Mb. In terms of consumption days, it represents only 20 days. If realised, it would be the weakest level since data have been collected in the 1960s, except for the season 1995-96. As it is difficult to ration demand, consumption is less volatile than supply. It means that if the production is disappointing, as it was the case last year, it is impossible for demand to decrease to the same extent than supply. In 1995, production failed by 27 percent because of a smaller yield and demand decreased by only 13 percent, leaving stocks to a low of 18 days of consumption. A similar situation happened last year. Moreover, when production is weaker than demand, stocks, expressed in days, tend to decrease sharply: -69% in 1983 and -52% in 1988. During nearly all the years mentioned above, prices more than doubled: +72% in 1982-83, +130% in 1987-88, +152% in 1994-96 and +135% in 2010-12. Therefore, if the U.S. experiences another dry season, the level of stocks could become dramatically low, and prices could skyrocket. However, recent storms have helped to replenish the soil moisture in the U.S. Plains. The heavy snowfall across the U.S. Midwest in late February provided hope to farmers that the 2013 crop season could return to normal after last year's drought.
|
 |
For the full version of the Diapason Capital Markets report, please contact info@diapason-cm.com