
February 4, 2013
The equities-commodities divergence has started to reverse
Commentary by Senior Market Strategist Robert Balan
Asset price moves have been unusual in the past few months. Equity prices have performed strongly, with the broad index S&P500(r) up 6% for the year. But other "risk-on" assets, such as commodities as a whole, have not performed as well. The exceptions are minor base metals which have turned in superb performances. Nickel, tin, and lead are up 9%, 6.4%, and lead is 5.1% respectively. And it gets better with the PGMs: platinum is up 9.4% and palladium has risen 7.6% so far. Within currencies, the pattern has been mixed as well. The JPY has sold off markedly, but not as much as the South African ZAR. Though the ZAR's performance seem consistent with commodities general underperformance (but it actually was weaker because of domestic issues), the BRL and RUB are two of the strongest currencies so far this year, due to growing underlying commodity demand in the larger emerging markets.
The relatively stronger performance of equity relative to commodity prices so far this year has been a departure from the close relationship between the two that had persisted since commodity prices capitulated when the global economy sank into the financial crisis in 2008. Indeed, 2012 was the first year since 1998 when the S&P500(r) index increased, while the WTI and Brent oil prices fell.
That positive correlation was fairly easy to understand: both generally benefit from stronger global growth, which tends to increase profits and demand for commodities, and both are relatively high beta asset classes so are a positive function of global risk appetite. So it begs the question of why equities can perform well while commodity prices effectively traded sideways. The key to the equity outperformance seems linked to high earnings expectations projected for H1 2013. Both expectations and actual earnings (so far) have been on the high side, and with the China story still uncertain going into the new year, commodities have lagged behind equities.
 |
Main drivers this week
|
Commodities and Economic Highlights
Commentary by Robert Balan, Alessandro Gelli, Marion Megel and Alban De Rougé
Emerging Markets: time to return
One big surprise of 2012 was the across-the-board slowdown in emerging markets. In the short run however, many indicators are pointing towards stronger growth ahead: for instance, we expect GDP growth to edge up from 3.9% to 4.3% in 2013 for Asia excluding China and Japan. In the past week, EM dedicated bond funds saw $1.6bn of inflows (0.74% AUM), while EM dedicated equity funds saw $3.66bn of inflows (0.45% AUM), according to EPFR Global. Dedicated EM investors continue to allocate money into EM assets - both bonds and equities.
Japanese and American investors comprise the largest bloc of capital source flowing into the EM funds. Last week, the BOJ announced a 2% inflation target (prev. 1%) and formally introduced an open-ended asset purchase program, which should directly support portfolio flows to EM from Japan. Fed Chairman Ben Bernanke has also just declared the determination of the U.S. central bank to maintain its $85bn a month purchase of assets for as long as the unemployment threshold of 6.2% has not been reached. The largesse from the Fed should continue to underpin inflows into EM economies as well.
Where domestic fundamentals have been or are turning more attractive to capital inflows, this stance is likely to enhance the scope for currency appreciation. The return of the EM space to outperformance levels should also boost commodities: accelerating FDIs in the early 2000s had been one prime booster of commodity prices at that time - it could well be the case again this time around.
Expect lower Chinese refined copper imports this year, despite revival in copper use
Until now, the copper bull story was easily understandable: China was devouring so much copper that it needed to import always vaster amounts of refined cathodes despite being the largest producing country. Last year, the combined effects of a solid real copper consumption (up nearly 7% according to our calculations, the highest growth since 2009), of declining LME copper prices and of an intense inventory rebuilding activity, prompted China to boost cathode imports during most of 2012.
This year could be different though. Although the country's use of copper should pick up along with its economy (we forecast a GDP growth above 8% this year), on the impulse of renewed expansionary policies and copper-hungry infrastructure programs, imports of refined copper could lower in the coming months. Neither the copper prices nor the inventory cycle should indeed encourage oversea purchases. The SHFE v. LME arbitrage is set to remain negative, considering the expected outperformance of LME prices and the continuing Chinese import duties. Moreover, China should enter a destocking phase imminently as domestic SHFE and bonded stocks are estimated to total more than 1 million tonnes, a probable record high.
In addition, China seems to have made the choice to favor domestic production over refined copper imports, as suggested by the recent inflows of copper ores and concentrates (mines copper which will be refined domestically), which nearly doubled from in the second half of last year, to hit a record high in December.
Saudi Arabia needs high oil prices more than ever
While production capacity stood at around 12.0 million b/d since 2010, domestic oil consumption rose by around 0.4 million b/d since 2009 to around 3.0 million b/d last year. Rising domestic production and stagnant crude oil production capacity imply that net oil exports capacity is gradually eroding. The share of domestic petroleum demand on crude oil production rose from 19.0 percent in 2002 to 20.5 percent in 2008 and 27.9 percent in 2012.
This is having two implications. Firstly, growing domestic oil consumption implies growing expenses for Saudi Arabia as retail petroleum prices are set at artificially low levels. The cost of subsidies is hence increasing while on the other hand, net oil exports are declining, leading to lower revenues. Furthermore, government's social and defense expenses have recently increased due to the Arab Spring and the rising tensions with Iran.
Finally, growing drilling activity suggests that Saudi Aramco's spending have risen. Thus, because of rising expenses and lower revenues, Saudi Arabia requires high oil prices more than ever. Thus, the Kingdom is likely prevent oil prices to decline below $100 as it did in December 2012 when it cut crude oil production by 0.5 million b/d m/m.
Winter Wheat: the new toll of the drought
The drought dubbed the worst since the Dust Bowl years has increased its toll on US winter wheat, reducing the condition of crops in Kansas, the top producing state, and neighbouring Oklahoma. The proportion of the Kansas wheat crop rated in "good" or "excellent" condition fell four points to 20 percent this month, while the proportion of the crop in "poor" or "very poor" health at 39 percent, up from 31 percent. Most districts received 50 percent or less of normal rainfall last month, at a time when they had already been in drought for months.
With Kansas and Oklahoma between them typically responsible for about 20 percent of US wheat production, the drought - which has a firm grip on the likes of Colorado and Nebraska too - has raised fears for the 2013 harvest.
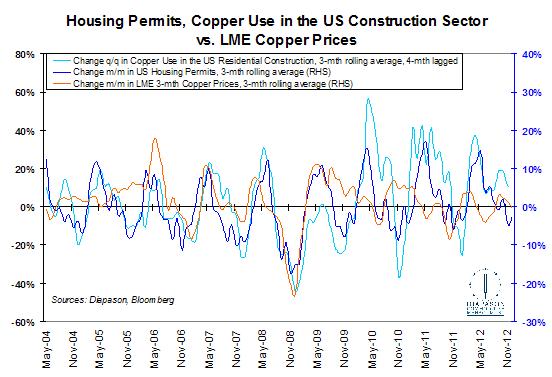
Chart of the week: The US housing market: an additional support to copper this year
|
China is currently the main market driver for copper, as it consumes nearly half of the world's supply. However, another industry could provide further support to the red metal's prices this year, the US property sector, which absorbs 45% of the American copper usage. The construction industry is on an upward trend. Although the recent growth has been mostly attributed to the mild winter temperatures, the sector is undeniably rising: in 2012, housing starts actually soared by 28.5% y/y. Approximately 200kg of copper is used in a typical US single-family house and 125kg in a multi-family unit. The conservative view of an additional 10% growth in the housing sector this year could provide copper a significant support, by boosting US total copper consumption to more than 1.9 million tonnes, a level not reached since 2007. Prices tend to lead the actual consumption of copper, as mortgages and housing permits provide in advance a solid view on copper use in the US construction sector. Watch closely the US mortgages and permits this year. |
 |
For the full version of the Diapason Capital Markets report, please contact info@diapason-cm.com