December 21, 2015
Long US Dollar: a crowded trade as the Fed decided on a slow pace of policy tightening
Commentary by Robert Balan, Chief Market Strategist
"The strong dollar view is writ large across all asset, regional and sector allocations. It will take a very dovish Fed and weak U.S. earnings to reverse the strong dollar view in 2016.” Michael Hartnett, chief investment strategist at BofA Merrill Lynch Global Research, 15 December 2015
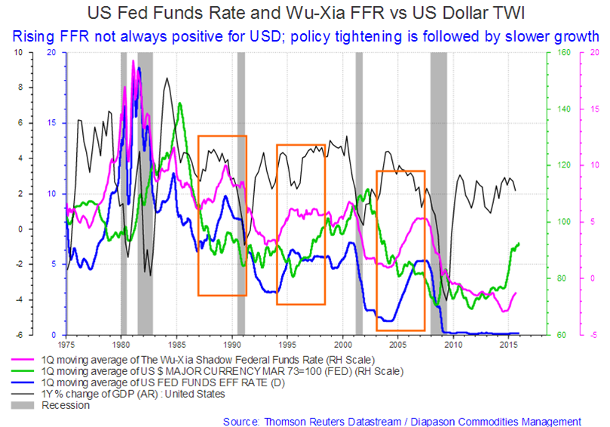
The US Dollar has been strong, in fact too strong for US multinational corporations and emerging market economies. And just about everyone believes it should get stronger as global central banks' monetary policies diverge — the Fed has just raised policy rates, and the ECB probably poised to conduct further quantitative easing over the coming months. None of that is new — that has been what's powering the US Dollar since mid-2014. There is a flaw in this stronger-US Dollar-for-longer argument. With the FOMC statements on Wednesday implying only four 0.25 basis points policy rate increases over the course of 2016, the huge US Dollar rally in the preceding quarters may have already fully priced those future rate hikes. Wednesday's rate tightening cannot be considered a surprise positive factor for the USD — as much as 76% of those surveyed by Bloomberg consider the move already discounted. There is also the historical evidence that the US Dollar tends to anticipate Fed tightening regimes and then fade out after the rate hikes are announced. Here is a look at what happened during the previous rate hiking cycles (see first chart of the week below). We see that at least in the initial stages of an increasing policy rate environment, the dollar tends to pull back. The 1994 and 2004 events saw more severe declines in the dollar while the dollar pullback was more muted in 1999.
The Fed’s tightening regime pushes up inflation, and could hurt the US Dollar
The market has been calling it "tightening" but the Fed of course is not really tightening policy. They are only raising policy rates — the difference is more than semantics. There remains plenty of money/liquidity in the system, and policy rates will be going up not because demand for money outstrips its supply, but because the Fed wants it so. The result of this rate rise regime will very likely be different from the results that followed prior the Fed tightening. This "tightening" regime is all scripted by the Fed, with the market being dragged along, perhaps grudgingly.
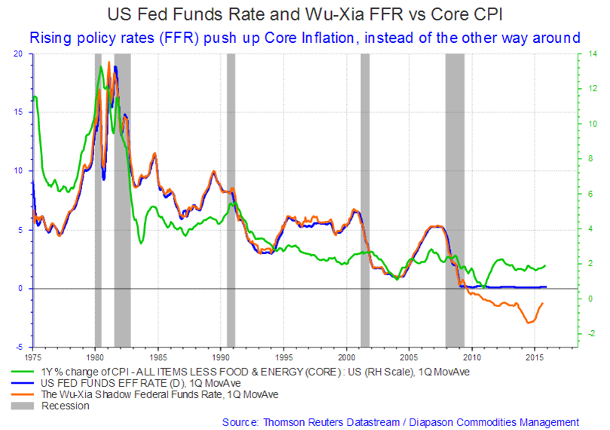
We believe that inflation will rise as the Fed continues to raise policy rates, because money velocity rises when interest rates rise and that leads to higher inflation. Why so? Because the Fed will not be reining in money growth during this regime, so inflation will continue to rise. Normally, it is the slowing down of money growth rather than the increase of interest rates that restrains inflation; increasing interest rates actually accelerates inflation growth (see second chart of the week below). The FOMC statements show that the Fed has no plans to slow money growth - nor do they have ways of doing it - so inflation will therefore continue to rise. It is a likely consequence as the Fed raises FFR rates in an "environment of abundant liquidity," which is what they call it when there are too many reserves in the system. At this point there are just too many issues that arise in actually restraining reserves to implement changes in interest rates. The second chart of the week below offers some interesting view of the positive dynamics between the Fed Funds rate and Core Inflation. Keep focus on this chart, especially on the tightening cycles: the early 1970s, the late 1970s, in 1983-84, the late 1980s, in the early 1990s, in 1999-2000, and the one beginning in 2004. You will see that in every one of those episodes, except for the one in 1994, core inflation either began to rise or has accelerated, after the Fed began to tighten.
We can be generous in the interpretation of this phenomenon. We can imagine that the Fed looked deep into the future and perceived that inflation was about to rise, and so decided to tighten policy in a spectacular anticipation of the fact. That is highly unlikely, as we also know that the Fed's forecasting abilities are quite poor (and even the Fed admits it). We have to ascribe this "price puzzle" relationship to a causality which starts with the Fed raising rates. Monetary economics and econometric work may be able to explain the phenomenon: inflation rises when the Fed begins to tighten because higher interest rates bring about higher monetary velocity, velocity being the inverse of the demand for real cash balances. The monetary principle works this way: when interest rates rise, investors are less likely to leave money sitting idle. Therefore, investors and savers play a game of monetary hot-potato passing which gets more frenetic the higher interest rates go. That activity is what generates higher monetary velocity. The effect of this activity can cascade within the monetary system very quickly.
The Fed tightening this time around is also a special case: the Fed is not doing anything to slow the growth rate of money, because to do that they would have to drain reserves and they don't know how to do that (and they might even fear the consequences). So we can expect money growth to remain at its current level, or perhaps even to rise as higher interest rates provoke more bank lending without an offsetting restraint coming from bank reserve scarcity (see second chart of the week below). The Fed has raised interest by diktat -- which will increase monetary velocity but will do nothing (at least, nothing worth worrying about) with the growth rate of money itself. This is inflationary, and we expect this to manifest by the middle of next year.
One of the reasons why commodity prices have done so poorly in the past 6 quarter has been the dearth of inflation. In fact, for a while, the financial world's biggest fear was that the global economy was spiralling into a deflationary trap. However, with the Fed's decision to finally get off the zero-lower-bound, we may actually find inflation reasserting its role. That would provide another role for commodities, which have been described by many economists as a good hedge for unexpected inflation. With the US Dollar expected to peak soon, and which may even weaken on a sustained basis, commodities should get a boost from these two factors by the middle of next year. We expect a very robust commodity price revival from there on.
Our next Commodities Insight Weekly publication will be on 11th January, 2016
We wish all our investors and readers a happy festive season and a successful 2016
 |
Main drivers this week:
|
Commodities and Economic Highlights
Commentary by Robert Balan, Chief Market Strategist and Sammer Khatlan, Oil Analyst
Markets cannot stay this short forever – risk of position-reversal increasing rapidly
2015 will end on a bitter note for oil prices. Market sentiment has never been lower as a confluence of negative factors continues to drive down the whole price curve, led by the front. To illustrate the spectre of doom that haunts the oil space, let us look at the market positioning: by December 8th, money managers and hedge funds had accrued short positions in crude (Brent and WTI combined) to a record high of 364,226. By way of contrast, the 2015 low for crude shorts was 119,567 contracts in May – since then speculators have increased their bearish bets by a huge 245 million barrels. The current total short position of 364 million barrels has outstripped previous records of 325 million barrels in August and 299 million barrels in October. Predictably, net-longs in crude have collapsed, retreating from the QE-fuelled peak of 626,184 contracts in June 2014 to 229,627 recorded for the week of December 8th.
With OPEC pumping at max capacity through its ‘market share’ strategy and the resilience of US crude production, speculators have become increasingly bearish as commercial stocks across key regions climbed to new record highs: OECD is close to the 3 billion barrels mark; and US commercial stocks are 15% above last year and the 5 year average. The market is in widespread contango.
This month has seen several developments emerge to exacerbate the negative sentiment: in its most recent meeting, OPEC failed to agree on an output target; negotiations with Iran have progressed to the extent that sanctions may be lifted as early as January 2016; and the 30-year old export ban in the US has been repealed. Prices have consequently broken psychological supports of $40 Brent and $35 WTI.
Liquidity is found at the front of the price curve, which is where most of the speculators have placed their bets. The fall below psychological price barriers has intensified the bearish sentiment in the market and overshot the downward move – this is what we are seeing at the moment. OPEC effectively removed any potential respite for prices in its last meeting, reloading the ammunition needed for the naysayers to break the dam. We do not doubt that there is a current crude oversupply in the market but we believe that significant fundamental factors are largely being ignored in the price complex – short-termism and momentum trading strategies are fuelling the downside. The collapse in global rig counts, deferral of capex, the volume of upstream projects being taken offline/cancelled and the financial strains facing OPEC and non-OPEC are not being paid enough credence – these all point to a worrying chasm in future oil supply. The hysteria and downward pressure on prompt prices is pulling the whole curve down excessively in our opinion – the back-end does not reflect the supply gap on the horizon.
The current price of oil and market positioning is not sustainable – we believe that the derivatives market in an overwhelmingly precarious position. The market’s reaction to several Saudi headlines in the run-up to OPEC’s last meeting illustrates the risk of upward spikes on anything bullish. There will be a reverse reaction and the risk of this is rising – the cost of buying protection against any unexpected price movements has become increasingly more expensive. For example, open interest in Brent call options tied to strikes from $50 to $80 per barrel have climbed sharply in recent weeks. Such a tremendous short position in the market will need to be covered at some point; the high level of implied volatility in the options markets indicates that dealers are preparing themselves for when speculators try to unwind their bearish trades. Risk-reward, it seems, is skewed to the upside.
The year 2015 was a horrible year for commodities, but 2016 could be completely different
The year 2015 will be remembered as "annus horribilis" for commodities -- the asset class got a very thorough hammering. This year will also be remembered as the year of the US Dollar, when all asset classes and the US economy were impacted by the greenback. And there goes the explanation for the poor performance of the commodities sector -- the strong US Dollar has been the major contributory factor for the sector's poor performance in 2015.
How did this confluence of events come about? The story actually began in late 2013 when the Federal Reserve started to taper Quantitative Easing program No. 3 (QE3). The series of QE programs has been providing the motive force for many asset classes, which have risen sharply, and was especially crucial for commodities as the QE programs have tended to keep the value of the US Dollar low against most major economies' currencies. Tapering bond purchases started to slowly push the US Dollar higher at first, but it started to rise faster after the Fed started to publicly ponder the ending date for QE3. After the Fed did terminate QE3 on December 2014, and with the Federal Reserve's public countdown to a tighter monetary policy, the US Dollar started to rise sharply. It was of course no surprise that the US currency was the top-performing asset class for the last six months of 2014. But this situation may change by late Q1 next year when we expect the US Dollar to peak (please see main story). A subsequent, sustained US Dollar decline should play a large part in a broader commodity sector recovery as from mid-year 2016.
While the greenback traded sideways for most of Q2-Q3 2015, investors started to price-in what many Fed watchers saw as the inevitability of a Fed rate hike before the year ends or in early 2016. Also for many investors, the question was not if, but when the Fed was raising rates. The Fed ended the suspense by finally tightening policy last week. Rising rates were also considered additional risk to commodity prices by some economists, but our work shows this is not so -- it is the positive impact of rising rates on the value of the US domestic currency that depresses commodity prices the most. At just about the time QE3 ended last year, the OPEC also decided to wage an oil price and market share war with non-OPEC producers, thereby adding to the downwards pressure for the entire sector, as oil prices collapsed sharply. The energy sub-sector quickly turned from best performing sub-sector to the worst in just a span of several weeks. The ongoing price war was further underlined by the inability of the OPEC to set collective production goals on December 4, thereby sending oil to another paroxism of falling prices, which is still ongoing. The first half of 2015 turned out to be a perfect storm for the commodity asset class as a whole as the confluence of negative factors brought the asset class down sharply.
The China situation, seemingly stable in the past few months, has ceased to be a major negative issue for the commodities asset class, although contributions to better sentiment still has to materialize. But finally we are seeing some positive response from the base metals sub-sector in terms of prices due to improving Chinese data and domestic equity market prices. These gains have been long in coming, but come they will. The Chinese government and central bank have basically pulled out all the stops in kick-starting the moribund economy with monetary easing and fiscal stimulus. The response has lagged due to the shotgun-style, incremental approach of Chinese authorities, instead of the bazooka-style approach that has been deployed by the US and Japan's central banks. But we believe that by Q2 2016, the collective stimulus effort by China during the entirety of 2015 will finally bear fruit.
It may be that a tentative recovery for the entire commodity asset class will be underlined by base metals in contributing to the previous gains tallied by the entire agriculture sector (soft and grain sectors in aggregate) since late Q2 this year. The line of thinking that we prefer should see precious metals and gold recovering in synch with an expected US Dollar decline in late Q1 2016. A recovery of the commodities asset class should be confirmed by a sharp reversal of energy prices by Q2 2016, after which we expect crude oil prices to go back to $65-$75 range again by year-end 2016. That should help provide a general lift-off for commodities over the next several quarters.
Charts of the week: US dollar tends to anticipate Fed tightening regimes and then fade out after the rate hikes are announced; increasing interest rates actually accelerates inflation growth
|
|
|
|