November 9, 2015
Cyclical sectors outperform defensives as recovery in China’s M2 money supply anchors the up-turn
Commentary by Robert Balan, Chief Market Strategist
"The nowcasts have shown slight upward momentum in the course of the past month, after several months in which momentum had been consistently declining. Whether this is the end of the soft patch in global activity, or merely a pause in the downward slide, is far from clear at present."
Gavyn Davies, November 01, 2015
At this juncture, there are strong signs of likely global growth in 2016, and perhaps even beyond. Key in understanding this future global growth lies in putting disparate but relevant elements together. Although the usual coincident measures of global growth like industrial production and the manufacturing PMIs have not turned yet, some survey-based leading indicators are suggesting that global activity stabilization is currently taking place, and the next phase in global growth evolution could be a recovery. A stable of positive Ifo global economic surveys sets the foundation of this forward-looking analysis. As the Ifo forward-looking data earlier warned, the first two quarters of 2015 provided disappointing global growth, the sharpest downturn since the strong recovery in early 2012. But the outlook has improved since then – global economic expectations and aggregate economic situation for all countries are expected to rise next year.
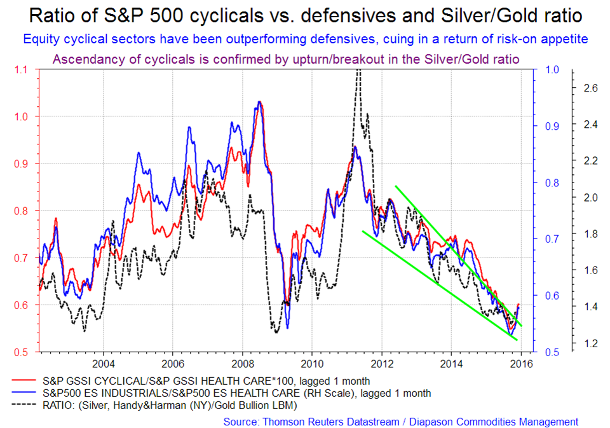
Some of the best leading indicators of global growth are asset prices, especially equity sectors and precious metals, or their derivatives. Stock prices, for instance, have been proven to have significant predictive power on output growth in many countries. Academic studies also show that the correlation between asset prices and economic activity stems from the fact that asset prices incorporate information about future wealth effects and inflationary pressures. But for us, the key information provided by the evolution of equity sectors and precious metals lies in the fact that the rise and fall of the price of these assets reflect the willingness of market participants to take “investment risks” – put simply, these asset prices have become indicators of “risk-on” or “risk-off” market environment.
Asset prices, which are available on a daily basis, provide a real-time dimension in tracking the global recovery, providing advance information on likely changes in industrial production and the global PMIs, and subsequently, on global GDP growth. Some asset priced-based leading indicators are also currently suggesting that stabilization of global activity is taking place, and the next phase in global growth evolution could be a recovery in 2016. These real-time developments are essentially providing a rolling confirmation of the growth outlook provided by the stable of Ifo economic surveys described earlier. This is how these indicators work: higher economic activity leads to better performance by cyclical assets and sectors which are geared towards global growth, but since information regarding global growth comes only after a very long lag, the evolution of these cyclical sectors provide advance information of what global growth could be as long as 2 quarters in advance. The information provided by these cyclical assets and sectors are especially critical at turning point in the global growth cycle – the very same situation the world economy is in recently.
As early as Q1 2015, it has been our view that global GDP growth could start firming up in Q3 2015, and a recovery process could start which may extend well into late 2016 and beyond. Indeed, the upturn and the subsequent rise of the Cyclical/ Defensive (Cyc/Def) ratio three months ago supports this forecast, and the Ifo forward-looking surveys. The best asset prices we found in providing real-time window to global growth are the ratios of S&P 500 Cyclicals sector over the Healthcare sector, the ratio of the S&P 500 Industrials sector over Healthcare, and the ratio of Silver prices over Gold (see the first chart of the week below). We will call these ratios Cyc/Def and Ag/Au ratios, respectively.
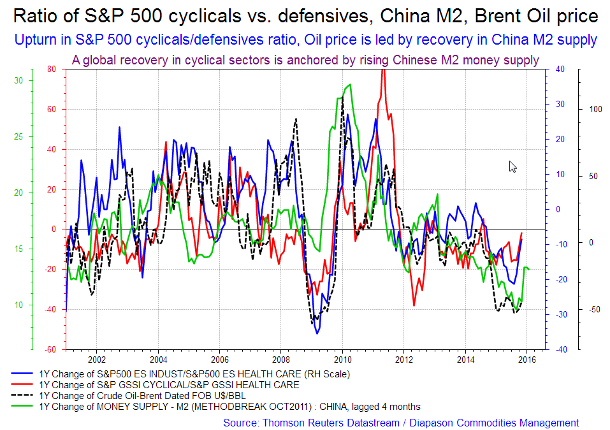
A re-acceleration of Chinese growth has become a major pre-requisite for global growth recovery in 2016. There is a lot of noise and speculation about growth in China, especially after the Chinese GDP fell to 6.9% on Q3 2015, the weakest rate since the global financial crisis. The buzz became even stronger after China’s monthly imports fell 19% in October, the 12th month in a row, giving concern that the shift to a consumer-based growth model is not having much traction. But as we said, merely tracking coincident indicators may prove counter-productive at certain times. One important forward-looking indicator for Chinese growth is the M2 money supply, and it has been rising in the past three months. What is unique about this data is that it also matches the evolution of the ratios of the S&P 500 cyclicals over defensives, making it a part of a stable of leading economic indicators. What is even more impressive is that China’s M2 money supply leads the evolution of Brent prices, the global crude oil benchmark. The Brent oil price itself is a coincident indicator of global growth, so an upturn in crude oil prices, which we expect soon, is a confirmation of the ongoing global GDP growth (see the second chart of the week below).
Indeed, money supply is rising in major global economies – in the US, China and Europe, and the world's money growth is near a 25-year high. Ambrose Evans-Pritchard of the UK Telegraph has this to say: “The damp kindling wood of global economic recovery is poised to catch fire. For the first time in half a decade of stagnation, government policy has turned expansionary in the US, China and the Eurozone at the same time. Fiscal austerity is largely over. The combined money supply is surging.” “A combined gauge of the global money supply put together by Gabriel Stein at Oxford Economics shows that the "broad" M3 measure grew by 8.1pc in August, and by almost as much in real terms. This is the fastest rate in 25 years, excluding the final blow-off phase of the Lehman boom.” “A parallel process is under way in China. Fiscal policy has swung from a violent crunch at the beginning of the year - hence the Chinese recession - to an accelerating take-off over the past four months. It jumped from 11.8pc in June, to 13.4pc in July, 14.8pc in August and 16.4pc in September.”
Recovery in China also became more likely as the central government commits itself to re-stimulating the economy with various measures such as further reduction in benchmark rates and the commercial banks’ reserve requirement ratio. The former is especially important as lower short-term rates tend to increase the country’s Total Social Financing level, which tends to boost the M2 money supply after a short lag. Short-term rates in China have been falling for the past three quarters, and for us it is just a matter of time before China’s M2 money supply also rises significantly. That should anchor a global recovery in 2016, and push the prices of cyclical assets like commodities and crude oil higher.
 |
Main drivers this week:
|
Commodities and Economic Highlights
Commentary by Robert Balan, Chief Market Strategist
The price of Agriculture commodities set to move higher on El Nino issues
Many agricultural commodity prices peaked in 2012, and since then moved lower as supply increased on a multi-year streak of good weather. The negative impact of a stronger US Dollar further depressed agriculture prices. The global economic climate deteriorated as well, further weighing on agriculture prices. However, the agriculture sector could find itself at the cusp of a turnaround, and this is due to non-macro reasons – we may have the El Nino to thank for this development.
The first agriculture product to move was rice. Rice is a huge global market. Many people around the globe, especially in Asia, depend on the grain as a major source of nourishment. The lowest point in the long rice bear market may have been seen in early May, this year, when the price of rice fell to $9.22 per cwt – just beneath the 2010 lows at $9.30 and to the lowest level since October 2006. Thereafter in mid-May, the price of rice sharply reversed its downtrend and started a rally which brought prices all the way to a $13.44 high in early October – an amazing 46% increase in six months. Rice prices will likely soar further later in the year as the negative impact of El Nino strengthens going into winter.
The background for this amazing rally is the same story for all surprise up-trend markets in agriculture products. A long period of low prices has discouraged ample crop production as the price of rice worsened over recent years. Then a major spell of bad weather hits production, and a new bull cycle begins, as producers have difficulties, and inventories that have dwindled to low levels become depleted quickly. This was the backdrop for rice in May this year when torrential rains in many of the producing nations, brought about by onset of El Nino, damaged rice crops. The price of the staple grain soared in response. Rice was the best performing commodity for both Q3 and the entire year in 2015.
The second agriculture product to respond to adverse weather conditions was sugar, when prices of the sweetener reversed course from its August lows. The previous sugar bear market was brutal. Sugar fell to as low as 10.13 cents per pound – a price plunge of almost 72% from its peak in 2011. This bear market caused sharp economic pain for growers and millers of the crop in Brazil, India and Thailand.
In Brazil, where sugar production is not subsidized, the pain was exacerbated by falling oil prices which curtailed demand for sugar-based ethanol. On top of those woes, the strong US Dollar severely weakened the Brazilian real which in turn encouraged Brazilian growers to sell and export more sugar, which further added pressure to the price. This has greatly contributed to a glut of sugar in the international market in recent years. Production and over-all supply levels were much higher than demand, so with that kind of fundamentals, prices were given little chance to recover. Until of course the weather pattern changed for the worse and prices jumped. Sugar prices started an up-trend from their August lows, and last week, the price of sugar rose to the highest level it has been since January 2015 when it reached 15.53 cents per pound. The rally of more than 53% in less than three months is a fitting correction to a market that had fallen more than a third of the price it reached in 2011.
The world this year will have to bear with the strongest El Nino phenomenon since 1997. El Nino, which forms when the part of the Pacific Ocean off the coast of Peru and Ecuador warms, tends to cause wild and unpredictable weather patterns around the world. The phenomenon may have formed off Peru and Ecuador, but as the inter-ocean jet stream circulates the warm Pacific Ocean waters around the globe, extreme weather events such as torrential rains, droughts and other extraordinary weather patterns are "exported" to the rest of the world. As the El Nino strengthens over the course of the winter season, these unpredictable weather patterns will continue to wreak havoc over agriculture production in many parts of the world, and will be instrumental in pushing agro prices.
The Cleveland Fed's Median inflation gauge rises the most since August 2010
We often invoke the Cleveland Fed's Median CPI as the best way to look at the central tendency of inflation, a view that is not foreign to the Federal Reserve which often cited it as providing the best “trend inflation” outlook of inflation in the US. Recent movement in Median CPI has bolstered our thesis that inflation in the US is in fact not dead, but has started to stealthily creep higher. This is probably known to the FOMC, although we have yet to see the policy members mention it as supporting factor in their meeting statements. We do not believe that the FOMC is unaware of this development – we even think that it may have contributed to the dominance of policy hawks in recent FOMC meetings.
The Cleveland Fed's Median CPI has risen to the highest since March 2009, and is now at 2.47%, rising from the 0.53% low that was seen in August 2010. The biggest factor that is pushing Median CPI higher is the salary component of the Employment Cost Index (ECI) which has again risen last month. The ECI (Wages and Salaries) leads Median CPI by one quarter, so it is reasonable to expect that Median CPI will be higher by year-end than it is today. With employment data breaking milestones every month, we expect wage-push (the classic prime mover of core inflation) to continue boosting US Median (or trend) inflation higher until early next year.
Increase in core or median inflation is occurring in most major economies, with the UK as a notable exception. This goes against the conventional wisdom being spewed out by the media and economics blogs that inflation is falling everywhere. We particularly cite the core Japanese CPI. Core inflation in Japan has risen to the highest level seen in more than 17 years. Obviously, the BOJ’s frenetic money printing is having a big effect. True, it may not be having much effect on Japanese growth, but it is providing the effect on what classic monetary economics predicts it would have on inflation.
Eurozone inflation is rising not as fast as in Japan, but inflation in the common market is indeed rising. But that should be expected, as the ECB has been less aggressive in easing monetary policy than Japan, or even the US. Still, the real situation is not at all what the popular press would have you believe – that the Eurozone is flirting with deflation.
These economies can only be said to be flirting with deflation if the energy price quotes are included. Energy quotes do matter (on the way up as on the way down) but adding energy in the equation is not at all helpful when predicting future inflation direction. All we understand is that aggressive monetary easing has pushed up inflation in Japan, as it now looks to be doing in the US. It may just be a matter of time before the common market may start grappling with the effect of rising inflation.
Charts of the week: Ratio S&P 500 cyclicals vs defensives and silver/gold ratio; Ratio S&P 500 cyclicals vs defensives, China M2, Brent oil price
|
|
|
|