November 2, 2015
US oil production is expected to keep on falling until at least February 2016
Commentary by Robert Balan, Chief Market Strategist
"Based on our projections of a horizontal rig count of 500-500 (operating-drilled but not operating) in the tight oil plays (the industry has been running between 540-560 during the past three months), we expect U.S. oil production to fall by 600-800mb/d during 2016, with monthly volumes bottoming around 8.2mmb/d later next year.”
Stephen Simko, Morningstar, October 24, 2015
Most of the analysis being done on crude oil issues is via statistical decomposition of the variables published by both the US Energy Information Administration (EIA) and the International Energy Agency (IEA). The result has been a confused mixture, with forecasts being all over the map, which is amazing if one takes into consideration the fact that all the analysts are using the same set of variables. However, our frustration with the inadequacy of the tools drove us to take on an engineering approach to analysis.
Root Cause Analysis (RCA) in industrial engineering applications is typically used as a reactive method of identifying critical events, causal factors, possible causal relationship between or among those factors, the root cause/s, the effect, and crafting viable solutions even before the effect happens. Put simply, RCA is a diagnostic tool to reveal the whys and the wherefores of an observed effect. A properly designed RCA can provide insights which allow pre-emptive steps to be taken. Take the tool one step further, and RCA can be used to forecast or predict probable events or effects even before they occur. That is how it is useful in the context of this analysis. The chart below shows the schematics of variables which may help in the determination of the desired “effect” – the evolution of US oil production, following the decline in the number of crude oil rigs.
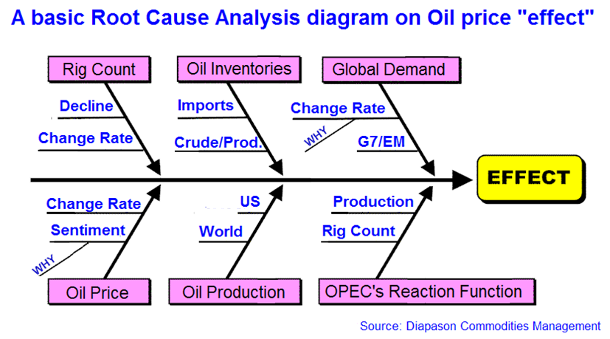
The heart of the tool is the analysis that establishes a sequence of events or a timeline for understanding the relationships between causal (contributory) factors, root cause, and the defined effect, which is, in this case, the decline in US shale oil production as a consequence of the recent sharp fall in crude oil rigs. Then we take another step forward and make the forecast or predict the events that may take place thereafter. This exercise needs only a rudimentary form of RCA, so we can basically ignore the rest of the tool's prescriptions after this stage.
These are the questions we ask in the spirit of RCA:
What is the response of oil production to the changes in oil rig count in aggregate? It can easily be proven (again in aggregate) that historically oil production changes lagged behind oil rig changes by 6 months on average. There have been variations in the quantitative response in oil production to the decline in rig count, bordering on non-linear. Hence, we are kept guessing as to what the variance in output will be this month or the following month/s. What is causing these variations? How can we get a handle on the forthcoming changes in output? If we know the change in rig count 6 months ago, can we know how much oil output will change this month (6 months later)? What factors will impact those expectations? If we know how long the change in rig count goes and by how much, can we use the information to project how oil shale production will fall and by how much?
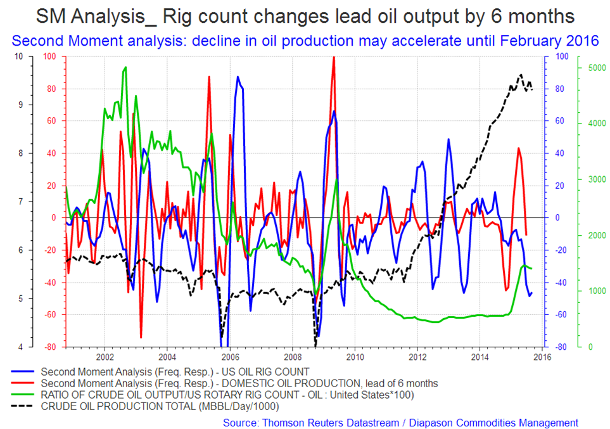
The answers to these basic questions can be found in the first chart of the week below. What information do we get from this chart?
Second Moment Analysis (SMA) studies the frequency response of changes in oil production to changes in the rig count. The analysis provided by SMA provides a picture of both the temporal and quantitative response. We see that the frequency in the changes in rig count is matched by changes in oil production with a very high degree of fidelity in terms of the periodicity in the temporal space, but not so in the quantitative space. There are times that the amplitudes (which represent approximate quantities) are commensurate – but there are also plenty of times that they are not.
There is a way of finding out why this may be happening and that is by a simple ratio of the crude oil output and the rig counts. In other words, we develop a history of the productivity of the oil rigs, in aggregate. The ratio shows that productivity has been falling since 2002, until November last year, when Saudi Arabia started to tighten the screws on US oil shale production. Productivity rose sharply from that time, but has plateaued since May. This confirms widely reported news that shale oil producers have moth-balled oil rigs that have marginal production, and enhanced more productive rigs with innovative technologies, or by using rigs that can move on tracks or legs, enabling them to drill and complete several wells at a time, slashing the time it takes to drill each well.
The productivity history also provided us answers as to the peculiar mismatch in frequency response of oil production to the frequency response in rig count during some periods (e.g. 2011 to 2014) – the production amplitudes have shrunk at those times. The answer may be one of these two (1) plenty of rigs with marginal output were put in place, or (2) the output per rig dropped considerably (which saying exactly the same thing as (1) from an aggregate point of view).
In summary, using this approach, we view that oil output may still fall over at least the next five months following the lead of the declining rig count. And oil production has plenty of catching up to do on the downside, as suggested by oil productions' recent (still very high) amplitude relative to the current amplitude of the rig count (which has fallen a lot). Especially so if productivity keels over, as it is now threatening to do. This should help support prices which seem to have reached the stabilisation range over the past two months.
 |
Main drivers this week:
|
Commodities and Economic Highlights
Commentary by Robert Balan, Chief Market Strategist
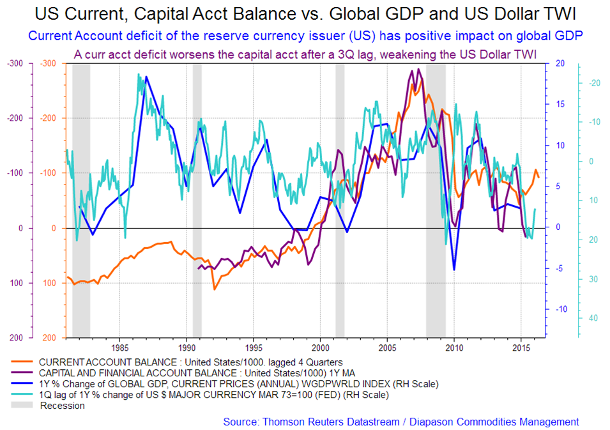
The US Dollar may weaken as the current and capital accounts deteriorate further
Goldman Sachs (GS) announced last week that they forecast the US Dollar to achieve parity with the Euro before the end of 2015. GS also has negative recommendations toward commodity-country and emerging-market currencies that include the Canadian and Australian Dollars – expecting these to weaken significantly versus the US Dollar over the next several months. As a corollary of this “stronger US Dollar” forecast, GS also believes that the price of crude oil will fall to $20/bbl, and that gold prices will drop below $1000 per troy ounce. The above outcomes are part of GS’s outlook of intensifying deflation and a surging greenback, along with continued declines for commodity prices. The GS forecast is based mainly on their outlook of US interest rates rising, which will cause other major countries with falling interest rates to lose out in the exchange derby. However, for us, this factor is less important than the broad trends provided by structural forces unleashed by global balance of payments.
At this stage, we consider that the parameters that really matter to the US Dollar are the US current account and capital account balance. The US current account has been deteriorating since 2014, and while the capital account is still trending positive, it will not be doing that soon. The US capital account deteriorates four quarters after the current account deficit widens. So it just at this time that we should soon start seeing capital outflows from the US accelerate, following the current account widening a year ago.
What happens then? The US Dollar has already started weakening as response to the widening of the current account deficit. We should see that weakness in the US Dollar accelerate once the capital account deterioration picks up pace. We can see the effect in the second chat of the week below.
The other thing that happens when the current account deficit widens is a positive impact on global GDP – global GDP should start picking up. Why is this? This stems from the role of the US Dollar as primary reserve currency and the impact works via the US trade deficit linkage. Shrinkage of the US trade deficit mechanically narrows the US current account deficit, which translates into woes for the Rest of the World (ROW). Why so? Because every time the current account deficit of the world's reserve currency issuer (the US) contracts, the global economy must also slow down. This is because the spender of last resort function can only be performed by the reserve currency issuer (the US), which was not in a position perform its role at this time, by political choice. The US trade deficit shrank in the past six quarters also due to the massive US oil production generated by shale oil, massively reducing the oil import bills. But that oil production is now sputtering, and so the reverse course is now taking place. Global growth should come via the US trade deficit in the past year.
As the reverse course takes place, the current account deficit continues to expand, and that should provide wherewithal for the ROW to grow. That will accelerate the deterioration of the capital account as domestic capital look for higher yield abroad. That of course weakens the US Dollar structurally. If US oil production falls precipitously, as many energy experts are suggesting, then we view that the US dollar will be placed in a severely reduced stature. And we could see that coming soon.
Why are resource producers still producing flat-out even as prices are tanking?
Resource prices have been falling precipitously in the past several quarters, but resource producers have been producing at the same, or even at an accelerated, rate than before. For instance, spot iron ore prices are down roughly 75%, yet the large iron ore miners continue to flood the market with way too much supply. This is happening even as the major miners are having their share prices hammered. Vale is down 87%, and Rio is down 45% over the past five-year period. These big companies control the iron ore market, yet they do not seem to care about (or understand) the importance of matching supply and demand. Moreover, they are harvesting their best product into a very weak end users’ demand market. Thinking logically, the current strategy seems total insanity.
This situation is true in many resource products. Think of oil for instance, or other commodities that are oversupplied in the market. Outside of commodities, no other industry seems to engage in this "destructive" behaviour. Logic tells us that the solution, albeit painful, is not complicated: stop growing capacity and cease flooding the market with excess volume. For iron ore, the producers can take the short term medicine and cut production by 20% - 30%. Then if the market does not respond quickly enough, cut another 10%, or until the desired results are achieved. But even this "solution" is not optimal – if a one producer cuts production by 30% in order to push the price by 30%, it is not an optimal strategy because revenues for that producer would drop by 9%.
So a cut in production is not the panacea to low prices?
Apparently it is not, that is, the solution is not this obvious. The situation the producers are in is a prisoners' dilemma situation in classic Game Theory. According to Game Theory (and common sense), the ideal strategy for all the producers would be to coordinate production to maximize industry-wide operating margins. However this strategy is unstable or unworkable because of several factors: (1) if any one producer secretly produces more, the extra profit this producer captures by increasing market share will be to the disadvantage of other producers participating in the price manipulation; (2) in the current market set-up, no one producer is large enough to single-handedly change prices meaningfully; (3) current anti-trust legislation within countries is reason for governments to sue participants if there is such a price manipulation; and most importantly (4) executives in the producer companies have fiduciary obligations to maximize the profits of their own corporation, even (or preferably) at the expense of all other producers. So there are no easy alternatives to the current situation of commodity resource producers "race to the bottom" with regards to economic, legal, and Game Theory perspectives. The current strategy may also have other undertones. There were news reports that BHP was using its pricing power specifically to drive competitors out of business. This is the strategy that Saudi Arabia has chosen to drive US marginal shale oil producers to bankruptcy. In the case of BHP, it may have calculated that it is better to take a loss now then make it up for higher profits at some future date. This makes sense if one also includes the calculation that it takes a lot of capital for competitors to build new mines and expand production to participate in a price recovery. By the time they get back to where they were before bankruptcy, BHP would be miles ahead.
Charts of the week: Rig count changes lead oil output by 6 months; US current, capital account balance vs. global GDP and USD TWI
|
|
|
|