September 7, 2015
US crude oil production could fall faster in coming weeks
Commentary by Robert Balan, Chief Market Strategist
"The world may run on oil, but the oil industry runs on capital, and for US shale producers that capital is starting to dry up... Capital raising by US oil and gas companies has slowed down significantly... Already 16 US oil production companies have defaulted this year..."
Financial Times, Ed Crooks, 07 September 2015
Crude oil prices continued rising by 2.84% last week supported by the news that crude oil production levels were revised lower for the month of June. Although continuing concerns over China undermined some of the large gains, the positive case remains on investors' speculation that the supply situation will continue to improve and that demand will continue to grow, incentivised by the low price structure. Looking at the supply side, our analysis suggests that US oil production is probably set to decline faster in the coming weeks, and sustain that momentum until the end of the year.
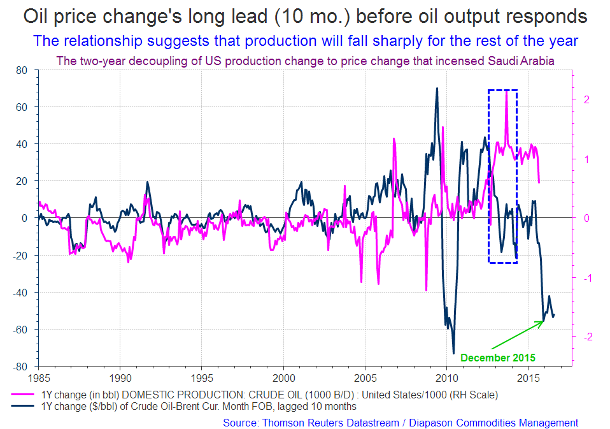
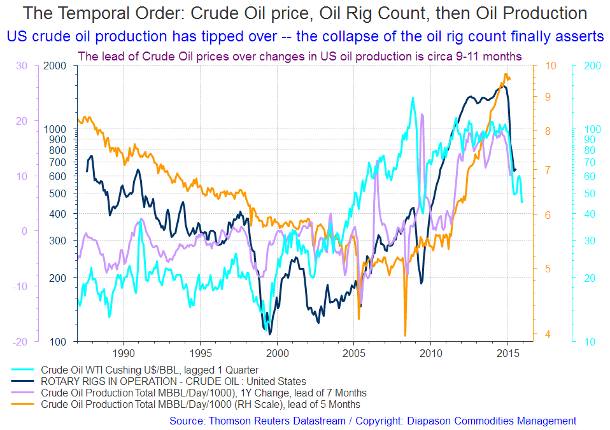
The relationship between the elements that will have a significant impact on future US oil output are shown in the chart below. It features the large, primary role crude oil price plays in the subsequent determination of the so-called "oil fundamentals". Crude oil price changes, as can be expected, strongly determine the aggregate number of oil rigs deployed, which in turn becomes the basis for oil output. Roughly, oil prices impact the number of oil rigs after 1 quarter, and oil production on aggregate follows that trend 5 to 7 months later (see second chart below). The lead oil price changes have on changes in oil output is 10 months on average. This is the basis for our assessment of large production level declines in the offing. But to get a numerical grip on prospective future changes, we follow the evolution of EIA's crude oil statistical summaries.
On August 31, the EIA (US Energy Information Administration) reported lower crude oil production numbers for June 2015, with some important implications. Parsing the EIA report shows that not only was the June data a major reversal compared to prior estimates, but that the sharp fall in oil rig count over the past several months is finally starting to have a significant impact on crude oil output. The EIA said that daily production for June averaged 9.296 million barrels of oil per day. The figure is still higher than what was produced last year, but it represents a significant decline relative to the 9.612 million barrels per day production in April, which is likely the peak of output this year. More importantly, the figure is much lower than the 9.599 million barrels per day production which was bannered in the EIA's previous weekly report.
It may not look like a significant change at first glance since oil production is still well above the 8.676 million barrels per day that was produced in June of last year. But the change was significant because the total production in June this year was 303,000 barrels per day lower than initially forecasted. This suggests also that oil production has been overstated by 9.090 million barrels over the course of the month, which is very significant when one considers that the size of the U.S. oil glut is probably around 91 million even before accounting for adjustments.
The EIA's weekly report also said that production in the week ending August 21st was expected to fall to 9.337 million barrels per day. This too is a big change – it represents the single lowest weekly oil production level since May of this year. There seems to be an emerging trend – the June data came in even lower and the EIA now suggests that production will decline significantly in months to come. It is therefore likely that the weekly data provided by the EIA is due for big adjustments which could depress output levels far lower than currently expected during the coming weeks ahead. We put this into perspective: if consumption remains constant, and oil production since June has been overstated by 303,000 barrels per day through August, this would imply overstated inventories in the U.S. It is possible that the EIA had actually overstated the data by nearly 27.88 million barrels. If true, this means that the size of the U.S. glut is far smaller at 63.12 million barrels.
These developments coming out of EIA has significant reverberations that will be felt going into year-end. Falling production numbers, a surprise inventory draw, and a rebound in Chinese equities contributed to the 27% increase in crude oil price experienced late last week. There were reasons why the oil market showed such verve, as discussed last week (see last week's Commodities Insight Weekly, September 01, 2015: Crude oil surged 27.5% over three days: what is driving the move?). One reason may be due to rumours that OPEC is willing to consider production cuts if non-OPEC members are also willing to cut their crude output. This should not, however, come as a complete surprise to investors – after all, OPEC has been open to production cuts (as long as non-OPEC producers will cut production as well) since late last year.
The past few days have witnessed a large increase in volatility for crude oil investors. With production falling (and likely to fall faster over the coming weeks) energy prices should make the upside adjustments that have been implied by the previous sharp fall in oil rig count. We expect China to stabilize its economy, and indeed tried to put a floor on its equity markets. The country's phenomenal demand for crude oil for its Strategic Petroleum Reserve (SPR) will remain a market feature whenever the price of crude oil makes a move lower. That is essentially a "put" for crude oil prices, going forward. Demand in China has grown: year-on-year growth in Chinese oil demand was up 0.6 million bpd in May. Furthermore, it will not also hurt the market if Saudi Arabia relents and rationalizes its stated desire to preserve market share by flooding the market with more oil. Non-Middle East members of the OPEC have been significantly hit by Saudi Arabia's opening the oil spigots, and have been looking for redress. Our opinion is that the Saudis are unlikely to offer relief to Venezuela and Russia immediately, but may reconsider when the OPEC meets again in December. It may be just a matter of time before it happens, but large supply adjustments are on the way.
 |
Main drivers this week:
|
Commodities and Economic Highlights
Commentary by Robert Balan, Chief Market Strategist
There's too much focus over crude oil inventory, which has no forecasting property
There is naturally a widespread perception that crude oil inventory is the primary driver of crude oil prices. However, this might not even have much influence on the price formation. But perception can be a big factor in crude oil price determination, and many traders and investors still equate a large inventory build with excess production which will go on to depress crude oil prices mechanically. There is nothing like empirical evidence, so we took the task of proving or disproving this linkage of inventory to production, or vice versa. This is what we found:
In the past when the US Dollar was importing most of its oil needs, crude oil inventory used to be a primary function of oil imports. But that has been changed by the abundant US shale condensate output, as the US now imports only a fraction of its domestic needs. So oil imports today have little to do with dedicated inventory building. There was indeed a tight correlation between imports and inventory build from decades past, right until 2005, when US oil production bottomed and started its parabolic rise. But after production stabilized and then took off sharply from a low point in 2008, oil imports have lost any meaningful bearing on the inventory build. Since then, oil imports has become primarily a trading tool for those smart people who have knowledge of producers' balance sheets and understanding of the direction of the US currency's primary trends.
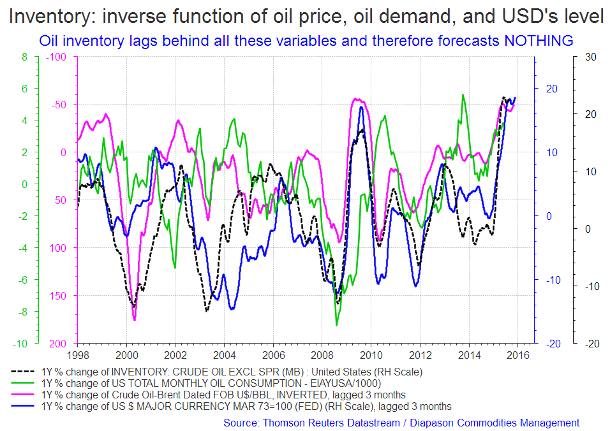
Inventory-build is still impacted by the level of imports, but the primary metrics that now determine inventory growth is the price of crude oil (which is also one way of saying, the level of the US Dollar), and the oil demand growth (see chart below). Inventory levels rise 6 to 8 weeks after oil prices fall, and vice versa. Simply put, inventory building is an opportunistic attempt to profit from a depressed crude oil price. The US Dollar has a less defined impact on inventory building, but the changes in the US Dollar levels begin to impact inventory builds 3 months ahead. We believe that the strength or weakness of the US currency is the swing variable in this three-factor relationship. Weaker oil prices plus rising US Dollar valuation is likely the optimum factor mix that triggers significant inventory builds.
So in our opinion, there is too much focus on inventory levels in the oil market, but maybe it is also a manifestation of how unreliable the crude oil data that is being cranked out by the EIA and IEA agencies have become. The market has resorted to data that could provide further clarity into the oil supply-demand equation during this period of market volatility.
Current inventory levels are still historically high, and that has created a meme which says that oil prices cannot go higher until this massive inventory overhang has dissipated. This sounds reasonable, but the logic is faulty if it is the low price of oil that is causing the build-up in inventory. The logic of this meme falters further if it is the strong US Dollar that is triggering the build. In the final analysis, we also point out that inventory building is also a mechanical inverse of crude oil demand. The more demand there is, there is less inventory build to speak about. Inventory builds are all of the above, but for one thing, there is no strong linkage between crude oil output and the rate of oil inventory growth, and therefore the inventory data is incapable of forecasting the future price of crude oil.
Is cocoa set to resume its up-trend phase?
Cocoa is a staple commodity with a large and commercially stable demand base around the globe. One important development in the cocoa consumption front has been the introduction, and acceptance, of chocolate in China's humongous consumer market. So now we have what has been called the "China chocolate syndrome" which speculates what happens if every man, woman, and child in China eats a bar of chocolate once a month. The answer of course is a perpetual bull market, a small-scale sample of which was seen in the past two years when Cocoa has risen due to increasing demand from Asia.
Once in around three years, cocoa traders also speculate about the incidence of El Nino, which will hurt cocoa crops disproportionately. There were false alarms, an example of which was last year, and the incipient bull trend would melt away. But this year, El Nino does bode ill to cocoa and several other agriculture produce that cannot stand extremes of heat and wetness, which is what El Ninos bring. Traders started to bid cocoa in April based on initial readings which suggest the possibility of a strong El Nino variant later in the year. Cocoa prices rallied by 25%. The CFTC's commitments of traders showed that managed money added almost a half a million tonnes of long cocoa to their trading books (plus short covering). But the trades were initiated too early, as the weather phenomenon took longer to develop. Cocoa prices have given up almost half their gains since April, but the trend started to reassert recently.
There is really some actual cause for concern with regards to this year's El Nino – it has developed to a point where meteorologists now say it could be the worst of its kind in history. Meanwhile, there has been very little rain in Ghana and in Ivory Coast, the area that produces most of the world’s cocoa crop, and weather forecasters are laying the blame on the incidence of this year's El Nino. If the cocoa zone does not get enough rain for the next two or three months, that may cause real damage on the cocoa crops.
The CFTC commitments of traders shows that at the July 2015 top in cocoa prices, managed money (speculators) were long about 50,000 lots, which is a significant amount for this commodity. Many speculators in cocoa (as differentiated from investors) do not dig into the fundamentals very closely. That could prove disastrous, as with El Nino, cocoa prices will be driven by the vagaries of the ebb and flow of rain in Ghana and Ivory Coast. The CFTC COT shows that the market is still long 35,000 lots in New York cocoa and 15,000 in London cocoa. This is still significant, but time may not be on the side of someone who wants to get long cocoa on the El Nino factor. The weather disturbance becomes more pronounced going into winter, and so waiting for a fewer number of long commitments may risk waiting too long. However, the ongoing drought may also provide a timing mode. If rain does not fall in the cocoa zone during the next two weeks, long positions may jump, with corresponding increase in prices. That should signal a favourable entry point in the long cocoa trade.
Charts of the week: Oil price leads output response; Temporal Order: Crude oil price, rig count then production; Oil inventory forecasts nothing
|
|
|
|
|
|