
July 13, 2015
Last week's crude oil sell-off is a fake-out: oil production may tip over soon
Commentary by Robert Balan, Chief Market Strategist
"Better-than-expected momentum in the global economy, especially in the emerging markets, would contribute further to oil demand growth in the coming year."
OPEC’s in-house research team, July 13, 2015
After having been stable for almost 5 weeks, last week saw energy prices decline sharply due to the confluence of geopolitical and oil data issues. In our opinion, that price decline has been driven by risk aversion and market psychology due to either Greece or Iran, not by a shift or imminent changes in the broad oil fundamentals. The Greece situation deteriorated significantly last week, increasing risk aversion, precipitating the sharp sell-off in energy prices. The oil markets also took some cue from the Iran nuclear talks, which were in the final intensive stages. The Iran impasse also helped depress oil prices and contributed to higher volatility. But the primary cause for the sharp price decline last week was US oil data, which normally would not cause that much damage, but its negative effect was exacerbated by the precarious market sentiment.
The July 3 EIA Petroleum Supply Weekly US oil inventory and rig count data was bearish at the surface, but that sentiment does not hold water on closer examination. The US weekly oil statistics showed that the build in crude stocks was 2.4 million barrels, the first increase in nine weeks, against unchanged expectations. The market took the face value of the EIA report and sold crude oil, but the internals are less dire – the increased build was driven by a large 748 thousand b/d increase in crude imports in the US Gulf Coast. No one should get overly excited about weekly changes in crude imports, which are understandably volatile, and it may have been more of the same last week. To put it into perspective, a VLCC holds about 2 million barrels, and if its arrival and unloading is delayed from one week to the next, it could wreak havoc on the weekly import data. We could see a decline of 286 thousand b/d in crude imports one week and a corresponding recovery in the same amount in the following week. What is significant is that the four-week average of US crude imports data have been roughly steady for the last month. This suggests to us that the anomaly this week will likely be smoothed out in subsequent weeks.
The weekly report also reported US oil-directed rig count to have added 12 rigs, breaking a 29 consecutive-week streak of decreases. This was added to the litany of supposed bearish evidence on the grounds that US oil producers were starting to reboot production as prices remained steady and production costs were lowered by technological innovations. The bearish argument is that if drilling resumes, that means production resumes as well. While the logic holds true, those restarted rigs should only contribute to the production stream 5 to 7 months later. Meanwhile, even if that is to happen, both preliminary estimates and monthly data from the EIA indicate that US shale oil production is fast declining indeed. The Energy Information Agency (EIA) released its short-term outlook (STO) on July 7, 2015, which projected that US crude oil output peaked in April. The revised production for the month was still at 9.7 million barrels, which is 300,000 barrels per day higher than previously estimated. The report says that May and June production levels fell to 9.65 and 9.61 million b/d, respectively. July's first weekly output statistics was estimated at 9.604 million b/d. The other statistics which may support the EIA's claim of output peak in April is the steady rise of US distillate product exports, which is fast approaching the 4 million b/d during the week ending July 3. US Net oil imports were also steady at circa 5 million b/d during the same period, and still on a downward trend. Rising exports and falling imports should diminish inventory levels, which figure very prominently in the oil market's price calculus mechanism, although our work shows that oil inventory levels are a function of the oil price. Inventory levels rise soon after oil prices fall, and vice versa.
EIA's own model results continue to show that shale output is declining. The flat preliminary estimates (or model results) in the weekly reports were implicit in their indications of increasing Gulf of Mexico output being offset by declining onshore (primarily shale) output. The oil market's fear that the recent rise in oil rig count will put the declining output trend in jeopardy is misplaced, in our opinion. The oil rig count has to stabilize first which will take a while, and then sustained increases for several months to reverse the declining shale output that the EIA reported to be taking place. We can show empirical evidence that those fears may not even materialize at all.
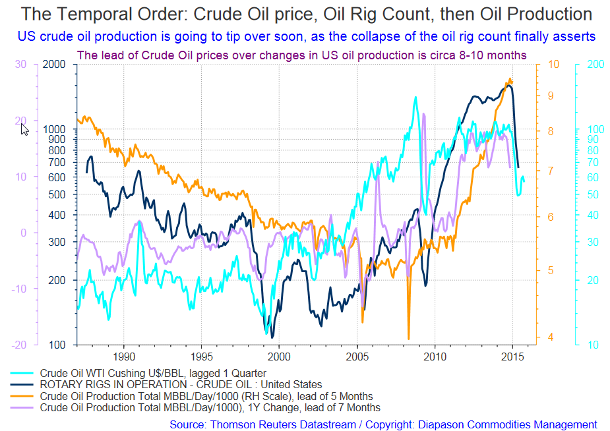
The chart shown below suggests the temporal order of these variables as thus: Crude oil price (dictated by the pace of global growth), then oil rig count, and last, oil production. The essence of the chart is that US crude oil production is going to tip over soon, as the recent collapse of the oil rig count finally reasserts (after several months of angst over the continued rise in production). The empirics show that the year-over-year change rate of oil prices has a 10-month lead over changes in production (which provided the early warning of an impending roll-over in the nominal). The nominal level of production of course almost always tends to rise further, even as the production change rate chases the price structure lower. The rough measure is that the yoy change tends to peak circa half the base period (of 12 months) earlier than the nominal. So adjusting the peaks of the variables and putting them in proper juxtaposition gives you the very distinct impression of US crude oil output indeed topping out in April 2015 – exactly when the EIA report said it did. That production did ease since the April top provides some comfort, but it does take a few more months of sharper declines to finally nail down a production peak as fait accompli.
A reversal of last week's sell-off is also getting help from elsewhere. The geopolitical aspects which contributed to last week's decline may be evolving as well. The Greek issue is still not settled as we write, but indications are that a deal is not impossible. That outlook has already re-ignited the equity markets, and improved market sentiment has already made a difference, even in Chinese equities which have declined as well for other specific reasons other than Greece. The intense late stages of the Iran nuclear talks continue in Vienna, beyond the July 7 extended deadline. There is always a possibility that one or all of the parties involved can walkout, but great effort is being spent to reach an agreement, and odds are that one will be made. There could be another negative knee-jerk reaction in the oil markets if/when an agreement is announced. But the bottom line is that Iranian oil will flow out to the world in gradual stages and only after Iran meets obligations under the agreement, and correspondingly verified. We expect significant Iranian oil volumes only by middle of 2016, by which time the market is already prepared to internalize it.
Global demand for products has been rising as a global reflation gets set to take place during H2 2015 which we discussed in length at (CIW, “Stronger H2 global growth should boost demand for cyclical commodities” May 11, 2015). With increased global growth comes an increase in oil demand. We figure that by the time Iranian oil is set to flow at anywhere close to its historic volumes, global oil demand would have already improved and so the increased supply should not create too much dislocation. Also, the volatility seen in the reported oil output data is symptomatic of a trend that is changing, especially so that the uptrend in US shale oil production has been taking place for almost two years. Models use the rising trend as base variable, so early deviations from that trend will fail to register well. But a few more months of lower production should confirm the trend that oil production in the US in finally heading lower. Combined increased oil demand and decreasing US oil production should combine to lift oil and products prices significantly higher in H2 2015.
 |
Main drivers this week:
|
Commodities and Economic Highlights
Commentary by Robert Balan, Chief Market Strategist
There may be relief coming for soft commodities in Q3 2015 tons
CCI Soft Commodities, an index of equally-weighted soft commodities (sugar, coffee, cocoa, cotton and frozen concentrated orange juice) is down 10.9% year-to-date but there are indications that there may be relief on the way. In Q2 2015, the sub-sector rose 5.5% and there may be more up-moves coming.
The leader of the pack is cocoa, which has shown all of the characteristics of a demand-based bull up-trend. A supply-side driven rally is the quintessential commodity bull market, characterized by sharp, volatile but brief up-moves. The other part of the coin is a demand-driven bull market, characterized by relatively slow, even measured up-trends, but they could last for a long time. This is the kind of up-trend that cocoa has been undergoing for some time. The cocoa rally began in late 2013 and has been proceeding in almost orderly cadence; every price correction has turned out to be another buying opportunity. The reason for this has been the developing love affair between the Chinese and chocolate which they have developed quite a taste for. China and the rest of Asia have been buying more cocoa beans and consuming more chocolate than ever before. This is reflective of the improved purchasing power of the people in the continent..
Given this broad fundamental demand-based support for cocoa, the news that an El Nino event is turning out to be another possible supply-based positive, provides the best of both worlds scenario for cocoa. The world's major growers of cocoa beans are Ivory Coast and Ghana, both located in West Africa. The two countries produce around 60% of the world's cocoa beans. The output in Ghana has been falling recently for a variety of reasons: the country expects to produce 22% less cocoa beans in 2015 compared to last year. Problems in Ghana have also been affecting the output in nearby Ivory Coast. These issues have propelled the price of the soft commodity. In addition, increasing El Nino concerns are leading analysts to conclude a supply deficit is highly likely during the rest of H2 2015. Increasing levels of consumption therefore put demand-based and supply-based factors together for a classic price push going into the year-end.
El Nino may also change the dynamics for coffee; last year’s best performing commodity registering gains of 44.00%. But it had rough times this year, after falling more than 20% in Q1. El Nino could change all of that, especially since coffee prices are low and not far from production costs. Brazil supplies circa one-third of the world's coffee beans and would suffer from drought in the event of an El Nino later in H2 2015. The demand profile for coffee is also being positively impacted by the trend of substituting coffee for tea in Asia. We believe that coffee can move higher later in the year as fears of a strong El Nino this year will bring buying into the market. Coffee is a potential mover based on growing demand and possible escalation of supply-related issues due to adverse weather later in the year.
Soft commodity prices are very sensitive to the weather which can make them very volatile at times. For soft commodities, it is either the weather or logistic issues that can make these markets move sharply. We are at a juncture where both of these issue are going to impact the soft commodity sub-sector in a positive way going into year-end. The other positive factor which lends broad support is the likelihood of stronger global growth in H2 2015. Empirical evidence shows that soft commodity price lag behind global growth by a quarter. In that aspect, we expect soft commodities to move broadly higher by Q3 2015.
This year's El Nino could be one of the strongest in 50 years
There is increasing evidence that this year's El Nino could be one of the strongest in the past 50 years. "El Nino has steadily strengthened over the past month and is now approaching strong category strength," stated AccuWeather Senior Meteorologist Brett Anderson, in a report on Sunday. An El Nino event arise and is triggered by rising ocean water temperatures to above normal across the central and eastern Pacific, close to the equator.
The report said that confidence is growing among the meteorological community that this year's El Nino could match the severity of the 1997-1998 event. El Nino events usually reach their peak from December to February. "Latest long-term climate modelling is very aggressive in strengthening this El Nino to near-record levels," added AccuWeather Meteorologist Ben Noll.
Meteorologists take pains to explain that not all El Ninos are the same. It is also true that natural climate phenomenon can also interact with El Nino, resulting in a wide variety of impacts across the globe. This year's El Nino is not an exception – it has been turbo-charged by a series of tropical cyclones which were instrumental in shifting the direction of trade winds, potentially increasing the warming potential which is now inviting parallels with the record 1997-98 event. Australia’s Bureau of Meteorology said on its website that "several cyclones, including a rare storm in the Southern Hemisphere this month, resulted in a strong reversal of trade winds near the equator". The Australian weather office further added that the reversal is "set to increase temperatures below the surface, which then may raise sea-surface temperatures further in the coming months."
El Ninos can modify global weather by creating droughts in Asia, dumping rain all over South America and generating cooler summers in North America. If the historical record does a repeat, this year’s El Nino will probably bring warmer, drier weather to palm oil growing areas in Southeast Asia, which decreases their yield, pushing prices up. It may also devastate rice growing areas in the Philippines, coffee-growing areas in Vietnam and sugar plantations field in India.
The temperature conditions are rising at an alarming rate, the Australian weather office said in their latest report. Three of five sea-surface temperature indices are at their warmest sustained weekly value since the 1997-98 event, the bureau said. "The so-called temperature anomaly in the central Pacific in June was the second warmest on record for the month, behind only 1997", it further said. The 1997-98 El Nino was the strongest recorded in history, according to data published by the National Oceanic and Atmospheric Administration.
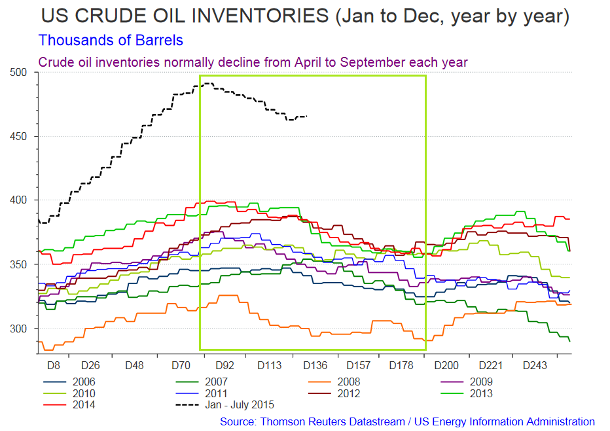
The temporal order; US Crude oil inventories seasonal pattern
|
|
|
|
For the full version of the Diapason Commodities and Markets Focus report, please contact info@diapason-cm.com