
July 6, 2015
Looking ahead at H2, more elements line up for a recovery in commodities. Stronger growth should help resolve issues seen during H1
Commentary by Robert Balan, Chief Market Strategist
"We estimate that our country's gross domestic product growth in the second-half of the year will be higher than in the first-half, they said, noting that it takes six to nine months for China's economy to feel the effects of monetary policy easing."
CNBC, qouting Ma Jun, the chief economist at the central bank, June 10, 2015
After one of the worst quarters - historically - to close 2014, commodities markets have shown healthy signs of stabilisation and turnaround in the first half of 2015. Supply and demand is rebalancing, this is translating into flat performance in commodity beta as represented by the Diapason Commodities Total Return Index (DCI® TR) for the first half of this year. The general term structure has shifted to contango as inventories replenished. Base metals have performed the worst in H1 (-10.84%) while the energy sector has performed better than the other sectors (2.81%).
In our global outlook report at year-end 2014 ("Outlook for the next year, 2015, and beyond", December 2014), we offered arguments why the US Dollar should shortly weaken, and saw compelling reasons for a bottoming in crude oil prices. The lynchpin of those arguments was our belief even then that the global economy would recover by mid-year, and would perform well during H2 2015, and even beyond.
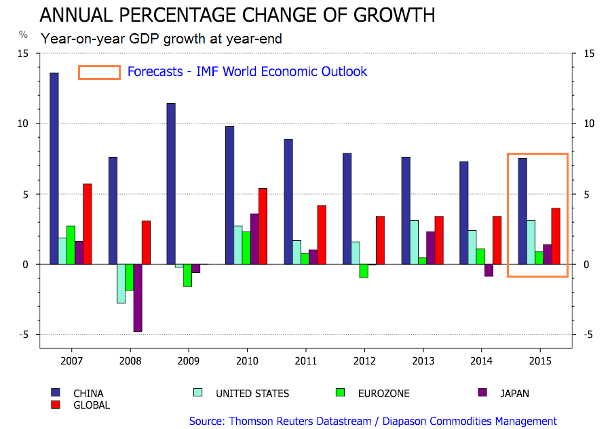
Following a very weak global growth in Q1 2015, mainly due to weather-related difficulties in the US and rebalancing woes in China, there are indications that global growth has finally taken a foothold in Q2, and should further accelerate during the rest of the second half of the year. US Q2 GDP will probably be just under 3.0%, while H2 2015 may average between 2.75% - 2.95%. The Eurozone and Japan are finally contributing to the positive column, and both countries had shown relatively robust growth in Q1, thanks mainly to competitive currencies, aggressive monetary easing, and the global panoply of lower energy costs. The strong US Dollar has boosted the trade balance of the Eurozone and Japan, at the same time that it had depressed that of the US. Lower energy cost was also a big boost to both countries, being among the largest consumers of crude oil. The effect of lower energy costs on the US, being a large consumer and a large producer at the same time, has been a wash.
China remains our primary concern in H2 2015. China's growth has flatlined for several quarters now, and has been a disappointment for us in Q2 2015. We thought early in the year that the policy easing and a wide variety of stimuli taken in H2 2014 would have impacted the Chinese economy in a very positive way by then, but apparently the slack in the economy was so much that further steps have to be taken. We are heartened by the news that the PBoC had cut rates to the lowest level in history, and targeted large RRR cuts. Indications are that this may not be the last of the policy easing moves.
Concerns regarding China revolve around property markets, corporate and local government leverage, and the still-significant overcapacity in some industries. The sharp correction in the Chinese equity markets after a massive rally adds further woes to the central government. But we see that as some sort of positive in a way, in that it has jolted the central bank and the finance ministry to take coordinated steps to prevent further deterioration of sentiment and the market. This will no doubt lead to more effort to protect leveraged investors, and that means easier money. Easier money derived by whatever means is what the Chinese economy, beset by relatively high financing costs, needs at this time.
The lagged effects of the considerable monetary policy easing in this and the previous quarters (and perhaps more quarters to come), the policy efforts to stabilize local government finances (with several debt swaps to extend debt maturity), a re-acceleration of public investment projects, and significant improvement in the US, the Eurozone and in Japan, should support a strong China recovery during H2 2015.
The outlook for EM Asia ex-China is brighter than the rest of the EM universe. Robust growth expectations for India are relatively bright, assuming the country carries out promised structural reforms. EM economies, ex-EM Asia, remain mixed. The remaining BRIC countries are still struggling; Brazil should bottom in a few months, but Russia looks mired in a recession for a few more quarters. Latin America EM is mending, but the recent decline in commodity prices has hobbled their recovery.
The global economy is expected to deliver circa 3.1% growth in H1 2015. With China ceasing to be a drag later in the year, H2 may deliver much better results than the current consensus of 3.9% GDP growth. With better growth prospects, many of the signature issues of the first half of the year should cease to be of concern. Deflation risks in the core developed nations, for one, have finally faded; the growth of actual inflation has been more robust than the pace of GDP growth in some countries. The Eurozone's inflation readings have surprised to the upside, eliminating the risk of a deflationary spiral. Crude oil prices have already risen circa 40 % since the January low, and that could contribute to a rise in prices globally. Contributing to the risk of faster inflation pick-up is the robust rebound in US bank lending to corporates, which eventually leads to further decline in unemployment and in rising wages, which in turn pushes up aggregate employment costs – historically a harbinger of rising inflation.
If H2 2015 global growth develops as we foresee it, the sentiment for commodities should improve as well. Stronger global growth removes a major allure of the US Dollar, so we expect it to progressively weaken during the rest of the year. Stronger global growth also means a pick-up in demand for crude oil and other cyclical commodities like industrial metals. A weaker US currency also improves the outlook even for defensives like grains and soft commodities, while boosting the value of precious metals, specifically silver and PGMs within the sector.
Higher inflation later in the year is a financial risk that is starting to be recognized by mainstream investors. Some large asset management firms are beginning to seek refuge in inflation-protected products. We believe that attention will shift to the protection provided by hard-assets, commodities among them, once inflation started getting traction. The price action from early cyclical commodities, like energy, is suggesting that the price bottoming process has started. The energy sector bottomed in January, and the agriculture sector has arguably made a significant trough few weeks ago. We expect industrial metal prices to stabilize soon and initiate a recovery once China shows firmer and more convincing growth visibility, which should not be too long now. With the different commodities sectors benefiting from these various catalysts, the asset class could be in place for synchronised performance across sectors and start generating strong beta performance in H2 2015.
 |
Main drivers this week:
|
Commodities and Economic Highlights
Commentary by Robert Balan, Chief Market Strategist
Update on the agriculture rally: price structure for the 2016 crop remains strong
The last two weeks of June brought a wave of relentless storms and rain, doubling the normal monthly rainfall. It also brought a strong rally in grain prices, especially corn. The abnormally wet conditions presented many concerns for U.S. farmers. Those fears were substantiated by the USDA – the outlook for grain prices looks radically different from what many observers previously thought after USDA's June 30 Acreage and Grain Stocks reports as stocks and acres planted came in substantially below analysts' expectations.
Corn, soybean, and wheat prices all rose significantly following the release of the report. Corn and soybean stocks, and planted acres estimates were below expectations. Some analysts even contend that the acreage devoted to soybean announced in the report was overstated, as it includes planting intentions that were likely not carried out due to the extreme wet conditions. On the other hand, wheat estimates were above analysts’ expectations for stocks and planted acres. But nonetheless, wheat prices were also bid following the significant rallies in corn and soybean prices on Friday. July corn prices added 18.3% for the month of June, closing at $4.14 per bushel.
The June USDA WASDE Report estimated US corn production for 2015/2016 at 13.63 billion bushels, unchanged from last month, and was 4% below last year's record levels. The WASDE report also estimated corn ending stocks for 2015/16 at 1.771 billion bushels, a 25 million bushel increase brought about by the reduction of corn use in ethanol production. Total world corn production for 2015/16 was estimated at 989.3 million tons. The 0.5 million ton decrease was due to lower production from the E.U., Nepal, Zambia, and Zimbabwe, which offset increases seen from Russia.
This brings us to our recommendation not to sell the 2016 corn in hedges. Recent reports point to significantly lower acreage, smaller than expected stocks, and significantly smaller yields that could cut into the supply. Agronomists suggest that the chance for another year of record yields is highly unlikely. Many agriculture analysts now say that the carryover could drop down to under 1.4 billion bushels, which is significantly less than the 1.9 billion bushels that was expected as recent as two months ago. The situation on the ground is such that no more yields can be lost going forward to July, August and September. This is especially more true now that the USDA found even less acreage for corn out in the fields. The situation suggests tightening supplies for this year — but more so particularly for 2016.
Jerry Gulke, president of the Gulke Group in Chicago, a research firm, said that even if farmers plant the same acres this year as they did last year, and get the same yield as they got last year, carryover stocks may still drop to 1.1 billion bushels, he also said: “somewhere along the line, if you don’t get the price of corn higher than what it was since we made the decision to plant corn, and if you don’t keep it above $4 or $4.18 or $4.25 in the 2016 crop, you could have a tight situation next year". The situation is such that farmers could see some price growth in corn even in the months ahead. The entire fundamental of the corn outlook, and for the rest of the grains, changed radically after the June 30 USDA report, and Gulke now believes that the $3 cash corn price seen a few weeks ago, which was the recent bottom, "is now probably a figment of our imagination going forward.”
The next four to six weeks is a critical period for corn and soybean development. Corn pollination occurs in mid-July, which is the most critical growth stage. The crop damage inflicted by the very wet June weather may be seen by late July, but in any case, poor pollination cannot be reversed. The June 30 USDA Crop Stocks and Acreage Report further boosted to the initial grain rally spurred by the wet and stormy weather which hit a wide swatch of the US Corn Belt. The next report at the end of July might well be the catalyst for another sharp rally in the grains sector.
Commodities could also outperform equities in H2 2015
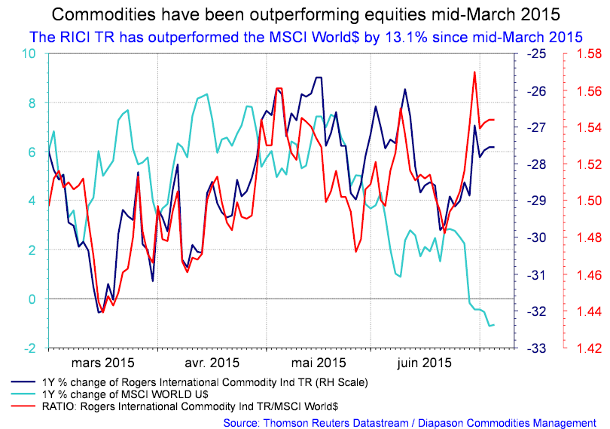
The ratio between RICI® and MSCI World Index has been rising since late May. Both energy and agriculture sectors have outperformed global equities by 5.99% and 5.58% respectively since May 27. We expect this performance to improve further as we go into the second half of the year. Our outlook for the remainder of 2015 is for global growth to rise more strongly as US growth resumes and China initiates a recovery (see main story above). This should likewise generate higher actual inflation, further adding allure to positively correlated commodities, but which in turn tends to diminish the performance of equities which have a lagged negative correlation with inflation.
Key to continued outperformance of commodities over equities over the medium-term is more sustained weakness in the US Dollar. The decline of commodities in the past several quarters can be directly attributed to the surge in the US currency over the same period. If our assessment of a firm global growth recovery in H2 is correct, then the same factors that would benefit commodities during the period should be detrimental to the US Dollar. For instance, it is easy to show a direct negative correlation between the changes in global GDP with the changes in the US Dollar. In fact, the most accurate negative proxy for the US dollar is the difference between global and US growth rates.
We are also convinced that the US Federal Reserve is unlikely to raise rates in September or anytime this year, further undercutting positive sentiments for the US Dollar, at least for the duration of 2015. The internals of the June jobs report were very far from stellar, and the most damaging were employment revisions lower from April and May by 60,000 jobs in total, and the sharp decrease in the labor participation rate (lowest in 38 years); if the participation rate was held constant from May, the Unemployment Rate would have risen to 5.7% in June instead of falling to 5.3% (from 5.5% in May). Most significant for us was the decline in weekly earnings from 0.2% in May to 0% in June; it is significant because the Fed watches the Employment Cost Index (ECI) as a gauge for cost-push inflation – weekly earnings lead the ECI by 4 to 6 months. Moreover, the manufacturing sector continues to be beset by a nation-wide decline in exports – factory orders dropped by 1.0% in May – no doubt still suffering from the lingering effects of the much stronger US Dollar. Manufacturing, in fact, contributed a significant part to the jobs lost in June. This set of jobs and activity data, for us, is not conducive for the Fed to raise policy rates soon. A delay in any policy rate hike will essentially undercut support for the US Dollar, which has been strengthening on the basis of policy rate differentials — expected higher policy rates in the US relative to the major economies increases the allure of USD denominated assets. But if the Fed is constrained by activity data, then it may be that the Fed will forego any rate hike this year.
Charts of the week: Global growth forecast; commodities index outperformed MSCI World by 13% from mid-March 2015 to end of June
|
|
|
|
For the full version of the Diapason Commodities and Markets Focus report, please contact info@diapason-cm.com