June 1, 2015
Upside potential firming for precious metals, and silver could outperform gold in H2 2015
Commentary by Robert Balan, Chief Market Strategist and Alessandro Gelli, Commodity Analyst
“As we speak, 40 per cent of gold mines are loss making, or marginal, breaking even at most”
Dr. Elize Strydom, Senior Executive at the Chamber Mines of South Africa, May 25th 2015
Gold prices recently fell back to early January 2015 levels, moving from $1225 an ounce in mid-May to $1190 an ounce last week, leaving the year-to-date performance close to 0.3%. However, this is in fact a relatively good performance compared to other commodities. The precious metals sector is indeed the second best performing commodity sector year-to-date behind the energy sector. The DCI® Precious Metals Index is up by 0.8% year-to-date, driven by silver prices (6.2% year-to-date), while the DCI® Energy Index is up by 1.4% year-to-date. This compares with the 0.21% year-to-date performance of the S&P 500 and, 2.29% gain for the 10yr US Treasury bond, year-to-date.
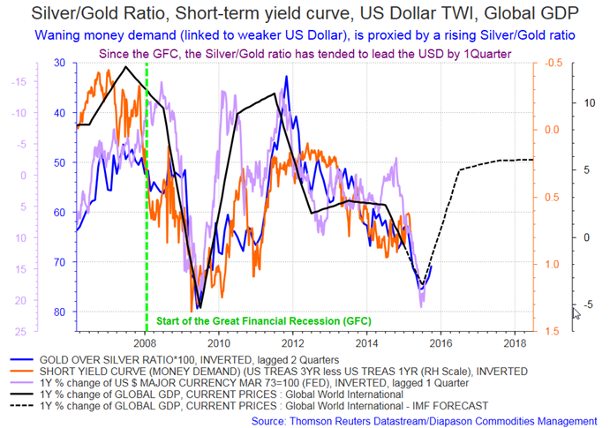
The outperformance of silver over gold since the beginning of the year is extremely interesting as this typically occurs in a risk-on friendly environment and on reduced worries regarding global growth. This also marks a major change from the second half of last year when the ratio reached 76, the highest level since early 2009 (just before the Big Reflation took off), a period generally recognized and characterized as a risk-off environment. This ratio is widely considered as a “risk-trade” indicator (see Diapason Commodities Insight Weekly, Silver and Platinum may soon outperform gold on improving global growth and the US Dollar weakness, March 30th, 2015) and its performance often reflects the general anxiety level of market participants. By mid-May, the gold/silver ratio fell to 69.3, the lowest level since September 2014, suggesting a possible return of the risk-on environment. However, the recent rebound in the US Dollar, driven by statements from Fed Chair Janet Yellen that rate hikes will likely start this year, and by some signs of more dynamic economic activity in the US (strong new home sales, higher consumer confidence), pressured the gold/silver ratio upwards as markets again worry about the fallout from a US policy rate increase. Nevertheless, we believe this should not last. Global GDP is expected to accelerate in the coming months, allaying fears of another episode of a risk-off environment. This should in turn contribute to a lower gold/silver ratio, or its inverse, a higher silver/gold ratio (see the first chart of the week).
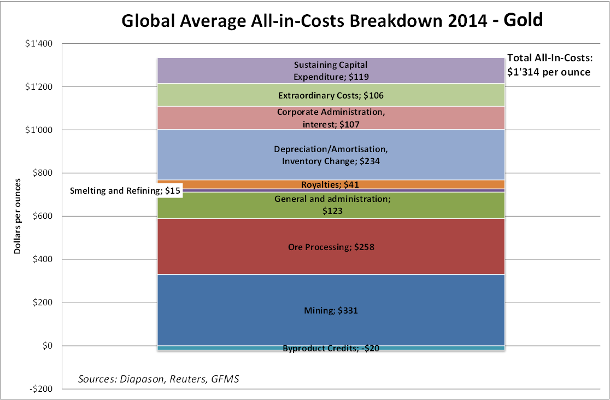
The current level of gold prices is proving difficult for many mining companies. Costs have increased rapidly these past years. Mining companies have been faced with higher power costs and rapidly rising wages. In 2014, the average all-in cost of gold mine production was $1’314 per ounce, above current prices (see the second chart of the week). While the all-in cost may have declined during the first half of the year due to lower power prices, and as the strength of the US Dollar these past 12 months mitigated some of the costs and weak international prices, US gold mining companies are not in a comfortable position. However, these issues won’t prevent Australia, the world’s second biggest producing country after China, to tally a further increase in gold production this year. In 2014, Australian gold production was at 24.3 metric tons, the highest level since 2000 and up by 34% in these past 15 years. This contributed in bringing global gold production to a new record high at 257 metric tons last year.
But supply risks remain, and may become more acute in the coming weeks. This week, South African gold mining companies are due to meet union leaders for the two-yearly wage negotiations. Already unions are calling for significant rises in wages. The National Union of Mineworkers is asking for an increase of up to 80% on the wages of the lowest paid miners. This year, tensions during the negotiations are likely to be heightened due to the continuing fallout of the 5-month strike in the South African platinum sector last year. It was indeed the longest strike in South African mining history, and was marked by sharp acrimony between labour and management, and was punctuated by violence. If South African labour adopts the same militant template (which yielded some remarkable gains for the mine labourers), the forthcoming gold mining negotiations could replicate the tensions of last year's platinum labour strike. It is something to watch carefully, as gold production in South Africa, the world’s sixth largest gold producer, accounted for 5% of global gold production in 2014.
Gold prices have been range-bound in the past two months, and what is significant has been the way support at circa $1170 has formed. Lacklustre ETF selling on the March $1150 lows suggested a relatively robust floor for prices above $1150. Prices have struggled to break through the $1225 upside resistance, with ETF selling again showing up at those levels. As we enter the seasonal period for consumption, physical demand is likely to offer some cushion to prices, although we expect $1170 area to be tested again shortly. The strongest barrier to higher prices now is the market's assessment of a likely September policy rate hike, but the Fed's current determination to raise rates "whatever the circumstance" may weaken if Q2 2015 GDP growth fails to clear 2.5%, generally considered by economists as the "trend growth" rate of US GDP growth. At the moment that is looking unlikely, as the Atlanta Fed's GDPNow forecast for Q2 GDP has been mired below 1.0% since early May. Blue Chip Consensus, which miserably failed to predict the negative growth in Q1, is still forecasting Q2 GDP at just below 3.0% but their forecast is now heading lower. Nonetheless, to us, Q2 growth in unlikely to clear 2.5% as the Fed expects, making it impossible to hike policy rates, however desirous they are in getting out of the zero-bound. Think of the consequences on the political "independence" of the Federal Reserve if an unwarranted rate hike precipitates a growth debacle along the lines of the 1937 recession.
Gold prices may therefore soon move higher, after another test of $1170 - $1160 area, when it becomes clear that the wherewithal for a Fed policy rate hike in September starts to dematerialize. Meantime, we expect support from physical demand shortly. Longer term factors, e.g. supply risks, should play a positive role in the foundation of a higher price structure for the yellow metal. We expect silver to outshine gold, and the gold/silver ratio to go lower during the second half of the year, when global growth is more firmly entrenched, and there is the clear return of the risk-on environment which favours cyclicals over defensives.
 |
Main drivers this week:
|
Commodities and Economic Highlights
Commentary by Alessandro Gelli
Supply disruptions lead to the outperformance of US crude over Brent
Since the beginning of May, Brent prices fell by 9.3% due to a stronger US Dollar amid clear overbought conditions. However, US crude oil prices outperformed Brent prices, leading to a narrower spread between Brent and WTI.
WTI outperformed Brent thanks to shrinking inventories at Cushing, Oklahoma and also because of supply disruptions in Canada. A significant wildfire has hit the north-eastern part of Alberta, close to some oil fields. This has forced some oil companies to shut down production. As of Thursday May 28th, about 10% of Canadian oil sand production (230’000 b/d) was halted as oil companies had to evacuate staff. This has contributed to narrowing the price discount of the Western Canadian Select with WTI crude oil to around $8.80 per barrel, the lowest level since at least end 2011. The strength in Canadian crude oil also positively affected the performance of WTI, which outperformed Brent. The Brent-WTI spread managed to fall below $5 per barrel.
The outperformance of WTI over Brent may continue as long as supply disruptions persist. Furthermore, the refining maintenance season is about to end in the US. Refineries there are experiencing high margins and are likely to run close or at maximum capacity. This should boost local demand for crude oil, adding further upside pressure on WTI. On the other hand, Brent may face further downward pressure as the Chinese refining maintenance season is about to start, leading to an oversupplied Atlantic basin.
Copper demand is accelerating amid constrained supplies
Alongside other cyclical commodities, copper prices fell in the second half of May by about 5%. Copper prices are now close to 6’100 per metric ton. But upside pressure is building on the red metal due to improving demand. Despite weak manufacturing PMI, Chinese copper demand has already started to accelerate, driven by the consuming sectors — copper is used in air-conditioners, TVs, electric cookers, microwave ovens, micro-computers and mobile phone equipment. This segment of copper demand is becoming more important in China as domestic consumption is becoming a greater share of the economy. We expect an acceleration of the Chinese economy in the second half of the year. This should contribute to boost further demand for copper from the industrial sector. Chinese copper demand growth could accelerate significantly in the second part of the year.
On the supply side, copper mining production growth is likely to decline compared with previous years. A significant amount of new mines are likely to come on stream: Buenavista (125’000 metric ton per year), Sierra Gorda (110’000 metric ton per year), Toromocho (100’000 metric ton per year), Casserones (80’000 metric ton per year), Ministro Hales (54’000 metric ton per year), Antucoya (40’000 metric ton per year) and Oyu Tolgoi (37’000 metric ton per year). However, this may not be sufficient to offset decline in output elsewhere. Strikes, floods and drought have already constrained the copper supply in Latin America and South-East Asia since the beginning of the year. The apparition of El Nino could also increase supply risks as it could cause floods in Chile and droughts in Indonesia.
Charts of the week: The silver/gold ratio and Gold All-in-Costs
|
|
|
|
For the full version of the Diapason Commodities and Markets Focus report, please contact info@diapason-cm.com

