
May 4, 2015
Contrasting speculative positions in the oil and grains sectors
Commentary by Alessandro Gelli, Commodity Analyst
“Exchange data show hedge funds and other large speculators have accumulated a record-breaking number of North Sea Brent futures and options contracts equal to almost 265m barrels of oil — the equivalent of almost three days of global oil demand.”
Anjli Raval and David Sheppard, Hedge funds bet big on oil price rally, Financial Times, April 23rd, 2015
April was an excellent month for the commodity asset class. The DCI® Global Index rose by 9.2% over the month, the strongest monthly gain since December 2010. However, the performance contrasted extremely among the commodity sectors. The energy sector posted the best performance. The DCI® Energy Index was up by 13.1% over the month, driven by oil, followed by the DCI® Base Metals Index, up 5.0%, making the cyclical commodities the strongest performers. On the other hand, the defensive sectors such as precious metals and the agriculture sectors lagged the other cyclical sectors. The DCI® Precious Metals Index and the DCI® Agriculture Index were up by 2.0% and 0.8% respectively. Within the agriculture sector, grains underperformed. The DCI® Grains Index fell by 1.7% over the month. However, the top and the worst performers — the energy and especially, the oil sector and grains — are showing signs of extreme market positioning. On the one hand, the oil sector is approaching overbought conditions, and on the other hand the grains are close to oversold territories.
Crude oil prices have been one of the best performing commodities in April 2015, rising by about 20% throughout the month. Brent prices have increased by more than $10 per barrel to $66 per barrel, the highest level since the beginning of the year. Stronger demand for oil and adjustments of oil producers to the low oil price structure have contributed to increase expectations of a more balanced oil market by the end of the year, amid growing geopolitical risks in the Middle East, pushing oil prices higher. However, the risk of a short term consolidation appears important in the oil market. There are still some macro and fundamental risks in the very short term, which could negatively affect oil prices. The refining maintenance season is not over, and crude oil inventories are likely to rise further. This could increase worries about available storage capacity. Furthermore, crude oil production is increasing outside of the US. According to preliminary estimations, OPEC production has increased to 31.3 million b/d in April, near a 2 1/2 year high, up 1.4 million b/d y/y. OPEC crude oil production has also risen by 0.9 million b/d from January 2015 levels, driven by stronger crude oil production in Saudi Arabia and Iraq; and crude oil production from Iraq is expected to rise in the coming weeks due to improved pipeline capacity in the northern part of the country.
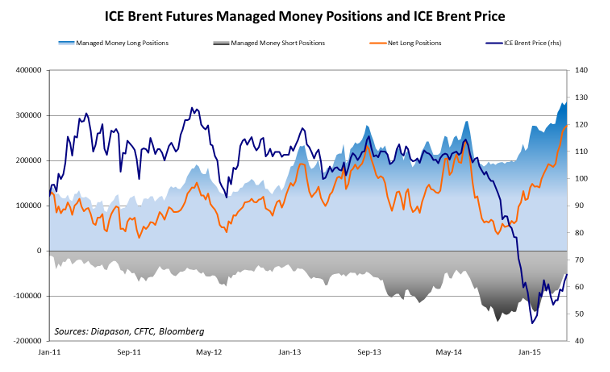
Furthermore, higher oil prices are also triggering a wave of hedging by oil producers. Brent prices on futures for most maturities in 2016 have recently moved above $70 per barrel from around $65 a month ago. Short positions held by physical actors (Producers/ Merchants/ Processors/ Users) on Brent futures rose last week to 1.3 million contracts, the highest level ever recorded since data started in 2011; two weeks ago, it rose to 467’000 on WTI futures, the highest level since October 2011. The rise in short positions by physical actors may continue at a more rapid pace if oil prices remain at current levels or move higher, adding downside pressure on oil prices. The elevated amount of net long speculative positions is also suggesting overbought conditions.
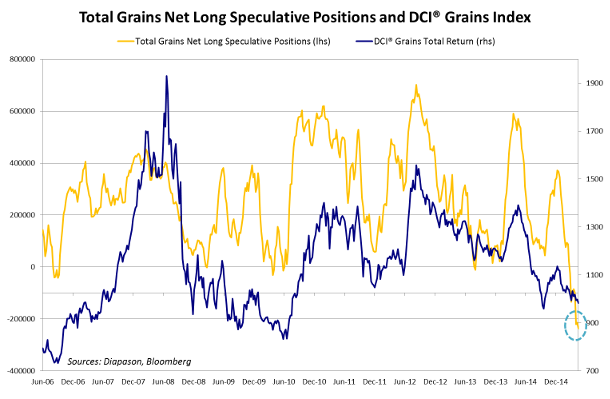
The situation is clearly different for the agriculture sector. Fundamentals have been weak these past few months due to excellent crop conditions, which followed a bumper harvest last year for most grains and elevated inventories. The DCI® Grains Index fell last week to the lowest level since October 2014 and the second lowest level since mid-2010. Most notably, wheat prices fell to a 5-year low. The recent downward move in grain prices was caused by the latest developments in Europe. The return of rain in the western part of Europe has helped dissipated concerns about wheat plants following dry and warm weather. The rain improved the soil moisture. Moreover, Russia is expected to remove a tax on wheat exports by mid-May due to falling domestic wheat prices. In the US, corn prices fell to the lowest level in six months as dry weather is expected to boost planting across the US Midwest. The bird flu reported in 13 US states and Canada also increased concerns about feed demand. In Australia, the wheat crop outlook has improved following heavy rain across Australia’s east and west coasts.
While the market is clearly pricing yet another excellent crop for this year — albeit not as good as last year — grain prices have a limited downside potential as they are significantly below the marginal cost of production, encouraging farmers to reduce spending. This in turn puts yields at risk, while short positions are at high level. On soybean futures, net long speculative positions are at a record negative level since at least 2006 when data started. Any supply concerns on grains could therefore trigger an important short-covering rally. But even without major supply disruptions, oversold grain prices could soon start to outperform overbought oil prices over the coming weeks.
This may be the final underperformance of oil and other cyclical commodities against grains and defensive commodities. Cyclical commodities and, especially, the energy sector are likely to outperform other commodities? in the second half of the year, driven by tighter fundamentals and the more favourable macro-environment — stronger synchronised global growth with Europe and Asia joining the US, weaker US Dollar, acceleration of China and higher inflation expectations. The acceleration of the global economy could in turn contribute to the underperformance of the defensive sector.
 |
Commodities and Economic Highlights:
|
Commodities and Economic Highlights
Commentary by Alessandro Gelli
Oil demand growth could remain strong in H2 2015
The upward move in Brent prices was triggered at the beginning of April by growing signs of adjustments of supply in the US, tensions in the Middle East and relatively strong demand. Demand could continue to positively affect oil prices in the second half of the year.
Demand for oil is up. China apparent oil demand rose by 6.5% in March 2015, to an average of 10.6 million b/d. This was the highest growth rate since September 2014 and above the first quarter average of +4% y/y to 10.5 million b/d. This was also the strongest annual growth on a quarterly period since 2012. This occurred despite slowing Chinese economic activity, implying stock building by private companies and probably the government for its strategic petroleum reserves. The Chinese government typically purchases crude oil when it estimates that the price of oil is low. New storage facilities also allowed the Chinese government to perform such operations. Moreover, US petroleum products demand has also responded positively to the lower oil price structure and is up by 4.3% y/y on average for the first 4 months of the year.
Global demand for oil may continue to grow at a more rapid pace than last year as low oil prices have also stimulate the global economic activity, which should accelerate in the second half of the year. According to the International Energy Agency, global oil demand could rise by 1.1 million b/d y/y this year, compared to a rise of only 0.7 million b/d y/y last year, which was the weakest growth since 2009.
Falling aluminium premiums may lead to a further cut in smelting capacity outside China
In April 2015, LME aluminium prices rose by more than 5% to $1’880 a tonne, the highest level since early February. However, despite the almost $100 per tonne rise, aluminium producers outside China are further under pressure. Indeed, while aluminium prices have increased, aluminium premiums have fallen by more than 50%. Premiums at Rotterdam (the price paid on top of LME prices for immediate delivery of aluminium) fell by $258 a tonne since the end of November 2014, to $169 a tonne, the lowest level since mid-2012.
The decline in premiums is implying that the selling price of producers have declined significantly. Premiums had previously increased to a record level at the end of last year because of strong demand for aluminium and queues at LME warehouses, which prevented the immediate delivery of aluminium. Last year, 5 LME warehouses experienced load-out times in excess of 50 days — and sometime more than a year, leading to higher premiums (for immediate delivery) on aluminium. Aluminium smelters benefited especially from these higher premiums as they can directly obtain aluminium from the production site. It is therefore not surprising to see at the end of last year Rusal taking the LME to court as the exchange was trying to implement a package of measures to reduce the load-out time at the warehouses.
The recent decline in premiums, which more than offset the rise in aluminium prices at the LME, suggests a growing likelihood of further cuts in aluminium smelting capacities outside China. Aluminium producers in China are subsidised by the government and received further help in the form of lower power costs imposed by the government. On the other hand, smelting facilities outside China are losing market share. In March, Alcoa, the world’s third aluminium producer, announced it would look at cutting or selling as much as 500’000 tons of annual smelting capacity, accounting for 14% of its total capacity. Since 2007, Alcoa reduced its smelting capacity by 1.3 million tons, which accounts for 2% of global smelting capacity in 2013. Further cuts by other aluminium producers are therefore likely. This in turn could contribute to higher aluminium prices.
Charts of the week: Brent and Grains net long speculative positions at extreme levels
|
|
|
|
.png)
For the full version of the Diapason Commodities and Markets Focus report, please contact info@diapason-cm.com