
April 7, 2015
Q1 2015 Review: Precious metals sector outperformed other sectors in an environment of strong US Dollar and risk-off for commodities
Commentary by Alessandro Gelli, Commodity Analyst
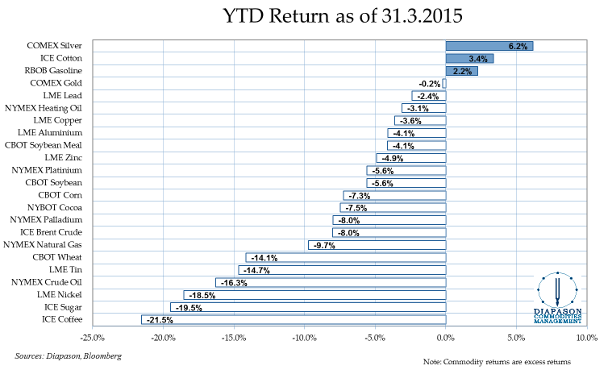
Commodities faced their third negative quarter in a row. The DCI® Global Index fell by 6.2% during Q1 2015. Among the asset class, the Precious Metals sector was the best performing segment, up 0.5% over the quarter as anticipated (see Commodities Insight Weekly, 2015 commodity outlook: Gold, a good opportunity to start 2015, January 12, 2015). The other commodity sectors (agriculture, base metals and energy) were, on the other hand, especially affected by the risk-off environment and the rise in the US Dollar. The US Dollar Index (DXY) indeed rose during the quarter by 9% to 97.8, the highest level since 2003.
AGRICULTURE: The agriculture sector, as can be expected, was extremely affected by this environment of strong US Dollar. The DCI® Agriculture Index fell by 9.0% throughout the quarter. The DCI® Meat Index and the DCI® Grains Index also declined by 8.8% and 8% respectively. The stronger USD came on top of the improving crop conditions in Latin America amid grains inventories being at or close to record levels. These past few months, US pork supply also recovered following a virus, which decimated the hogs population in 2013 and early months of 2014. But the worst performers within the agriculture sector were soft commodities. The DCI® Softs Index dwindled by 14.3% over the quarter, driven by improving conditions for coffee and sugar in Brazil. ICE Coffee and Sugar fell by 21.5% and 19.5% respectively, the worst performing commodities in Q1 2015. However, agricultural commodity prices fell to extremely low levels — alongside rapidly rising short speculative positions — as the market is anticipating almost perfect conditions for this year’s crops. Any negative changes in the crop conditions may lead to a rapid short-covering rally.
PRECIOUS METALS: The performance of the precious metals sector, also considered as defensive, contrasted with the Agriculture sector. However, this time, the precious metals sector benefited from rising political tensions in Europe with the election of Alexis Tsipras in Greece and the persistent risk-off environment which started in mid-2014. These 2 factors more than offset the impact of the rising US Dollar. The convergence of the US Dollar and precious metals is worthwhile noting as they have typically a significant negative correlation. Silver was the best performer (+6.2% in Q1 2015) within the precious metals sector — and of the overall commodity sector as well — as the risk-off environment started to fade in March 2015. In the third week of March, the gold/silver ratio fell close to 70, the lowest level since October 2014, and down from 76 reached at the beginning of the year, which was the highest level since early 2009, the height of the previous major risk-off environment. Due to its cyclical nature, silver may outperform gold prices further as the risk-on environment is gradually coming back in the commodities sector.
ENERGY: The energy sector continued to decline for the third consecutive quarter. The DCI® Energy Index fell by 7.3% over the quarter. However, the downward move has lost momentum. Oil prices recovered in February 2015 due to supply disruptions in the Middle East and North Africa amid confirmations of adjustments by oil producers to the new low oil price structure. Concerns about rapidly rising crude oil inventories especially in the US nevertheless ended the price recovery in March and led to a downside move in oil prices. However, Brent and petroleum products did not make a new low in March in contrast to WTI. This is a constructive behaviour. The oil sector is nonetheless still at risk in the first part of Q2 2015 on rising crude storage utilisation rates, but the potential of a significant recovery in the second half of the year is increasing. Geopolitical tensions are rising in the Middle-East and in Africa, while massive cuts in capex at the beginning of the year by US oil producers should soon lead to significantly slower crude oil production growth in the US. Most conservative international energy agencies are already anticipating the return of a balanced oil market by the end of the year. But they may have underestimated the rebound in global oil demand — last year, global oil demand growth was the weakest since 2009 — as global economic growth is accelerating amid higher risks of important supply disruptions. The oil market could therefore rapidly return into a deficit at the end of 2015.
BASE METALS: Like the energy sector, the outlook for base metals is becoming more supportive for prices following a relatively weak first quarter. In Q1 2015, the DCI® Base Metals Index fell by 5.9%. This was caused by lower energy prices, which reduced costs to extract and processed ore and especially because of disappointing economic data from China. Nonetheless, the Chinese government promised to keep the economy on track (in order to preserve social stability) and has implemented new pro-growth measures. These are likely to have a positive impact on the demand for base metals soon as they lay the foundation for stronger economic growth in the second half of the year. The Chinese government has for example cut the cash down payment for second-home buyers in order to help the real estate market, while the central bank has been injecting more liquidity into the economy.
LOOKING AHEAD: During Q1 2015, the strong US Dollar, the risk-off environment and weak fundamentals contributed to a further downward move in commodities prices. This move is now very extended and the downward momentum is stalling. Some commodities may however still face some final downward pressure until mid-Q2, while other commodities seemed to have already bottomed. The reaction mechanisms to low prices have started to appear i.e.: demand improvements and supply response, while the macro-conditions are gradually turning in favour of commodities — stabilisation of the US Dollar, stronger global growth and the return of the risk–on environment. These elements are suggesting that the rest of the year may be very different from Q1 2015; 2015 could end on a very positive note for commodities.
 |
Commodities and Economic Highlights:
|
Commodities and Economic Highlights
Commentary by Alessandro Gelli
The Brent-WTI spread could widen further
The oil surplus is contributing to an important rise in crude oil inventories. The build in inventories is especially visible in the US due to the availability of high frequency data. In Q1 2015, US crude oil inventories rose by 89.1 million barrels since the beginning of the year (vs. an average rise of 25.7 million barrels in the previous 5 years) to 471.4 million barrels, a record level. The build was particularly important in the Midwest and especially at Cushing, Oklahoma - the storage hub. The elevated contango on WTI also encouraged crude oil storage in this region.
The rise in crude oil inventories at Cushing to 58.9 million barrels, also a record level, contributed to an important downward move of the WTI relative to Brent from less than $2 per barrel to more than $10 per barrel at the end of February. The spread then gradually narrowed towards $6 per barrel. The recent narrowing was caused by stronger than expected refining activity in the Midwest and in the Gulf Coast. Expectations that production growth will slow down in the Midwest also contributed to the recent outperformance of WTI over Brent.
However, this should not last. Crude oil inventories are likely to rise further to dangerously high levels. The storage utilisation rate at Cushing is now at 77%, a high level — previous record levels in early 2011 reached about 90%. While we may have passed the peak refining maintenance season in the US (which is occurring ahead of other regions worldwide), a significant refining capacity should still continue to perform maintenance work. WTI front months are therefore likely to be under pressure in the coming weeks as the storage utilisation rate rose closer to full capacity. The situation may ease in May as refineries are restarting activity after having performed maintenance work. A wider Brent-WTI spread would also mean higher refining margins, encouraging refiners to boost activity.
Over pessimistic view on commodities suggests oversold conditions
The positive sentiment on the commodities sector remains at an extremely low level. The DCI® Weighted Commodities Sentiment Index 3-month rolling average stood last week at 27.9, slightly up from the 24-year low reached at the beginning of February 2015 (at 26.5). In the oil sector, the positive sentiment has fallen to even lower levels than in 2009. This was due to the fact that the current decline in oil prices was mostly supply-driven — while it was demand-driven in 2008. Adjustments from the supply side are traditionally taking a longer time than those from demand, leading to the extremely low positive sentiment on the sector. But this may not be true anymore. The tight oil, which contributed to the major oil surplus, is significantly more price-elastic than conventional crude oil. US crude oil production is likely to grow by a significantly weaker amount this year due to the response of oil producers to the low oil price structure. The US Government estimates that US crude oil production could decline between May and December 2015 by about 100’000 b/d, a significant change from last year, when US crude oil production grew on average by about 100’000 b/d per month. In the coming months, investors may thus be surprised to see these unusual rapid adjustments from the supply side.
The sentiment on commodities is also negative among commodities producers and, especially, oil companies, which suffered the most from the recent decline in commodity prices. The 60% decline in oil prices between June 2014 and January 2015 has indeed triggered a wave of large cuts in expenditures in the oil industry. The combined layoffs announced by the top three oil services companies (Halliburton, Schlumberger and Weatherford) were 23’400, accounting for almost half of the expected layoffs caused by the decline in oil prices (about 50’000 workers). RBC Capital markets also estimated a cut in capital spending by 20% ($86 billion) for 2015, driven by exploration & production companies (-31% y/y or -$52 billion). Another reflection of the rapid response — and the negative sentiment — by the US oil industry is the significant decline in the number of US oil rigs. Since mid-October 2014, it has fallen by 49% to the lowest level since March 2011. This was the most rapid decline since at least 1987, when this set of data started to be published. The sentiment on commodities and especially on oil appears over-pessimistic.
Charts of the week: Commodities performance in Q1 2015
|
|
|
|
.png)
For the full version of the Diapason Commodities and Markets Focus report, please contact info@diapason-cm.com