
March 30, 2015
Silver and Platinum may soon outperform gold on improving global growth and the US Dollar weakness
Commentary by Robert Balan, Senior Market Strategist
"While gold and silver are often grouped together in investment discussions, gold has more of an Armageddon appeal and silver has more of an industrial appeal. Generally, when the gold/silver ratio is rising, it signals higher levels of fear and concern about the economic outlook.”
Chris Ciovacco, Monitoring the “Risk Trade” with the Gold/Silver Ratio, The Market Oracle, January 21st, 2011
The precious metals sector continued to be particularly attractive. Contrasting with other commodity sectors, precious metals did not make a new low during the recent US Dollar rally. Furthermore, the Fed's modified stance on policy tightening two weeks ago is providing a catalyst for precious metals to bounce off recent lows. The DCI® Precious Metals Index rose by 4%, following the US Fed’s new summary of economic projections on March 18th. The US Dollar may continue to weaken in the near future (See Diapason Commodities Insight Weekly, Will the Fed’s surprising prudence lead to a US Dollar reversal? March 23rd, 2015). This may coincide with a global growth pick-up while the risk-off environment gradually fades. The weaker US Dollar is laying the foundation for further recovery in precious metals prices. However, stronger global growth and reduced perception of risk in the system should benefit some precious metals more than others.
The decline in the US Dollar positively affects the overall precious metals sector. But the acceleration of global growth, and more specifically the prospect of future wider growth differential between the US and the rest of the world in favor of the latter, will probably be just as significant as a weakening of the US Dollar in pushing precious metals higher. US growth was indeed spectacular in Q3 2014 when GDP quarter-on-quarter growth hit 5%, the strongest since Q3 2003. But economic data in the US have deteriorated markedly since January. This is in contrast with the more positive outlook from the rest of the world (ROW), whose economies started getting traction after aggressively easing during the second half of last year, following the lull in US monetary policy adjustment.
Prospective US Dollar weakness and stronger growth in the ROW are already contributing to the outperformance of the most cyclically-driven precious metals within the sector. So as the risk-off environment continues to fade, the underperformance of the most defensive precious metals will continue.
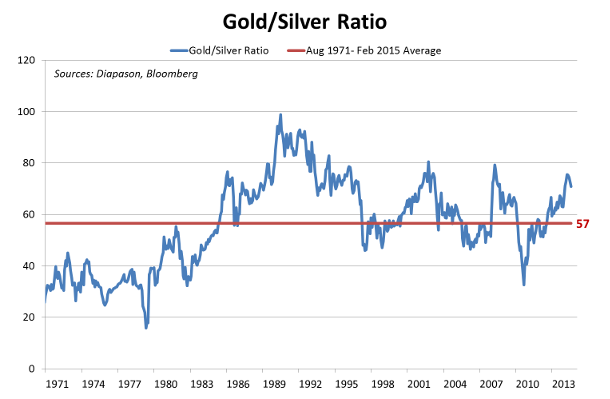
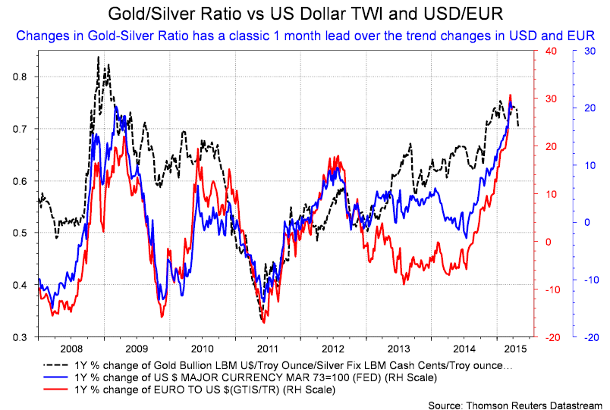
The gold-silver ratio is probably telling us something in this regard. The ratio is typically a “risk trade”. A significant rise in the gold/silver ratio typically reflects rapidly growing credit/market risks. Following the Lehman’s crash, the ratio rose sharply above 80 as gold outperformed silver, reflecting extremely difficult monetary conditions at that time. But the opposite is also true. In 2011, the QE2 program contributed to greatly ease monetary conditions, leading to a significant outperformance of silver against gold. Since the end of Bretton Woods in August 1971 the average for the gold-silver ratio has been 57:1, or 57 ounces of silver value contained in each ounce of gold value (see the first chart of the week). That relationship closed last week at just over 70 which was an improvement from the 74 it was trading at prior to the Fed announcement. Changes in the ratio also have a classic 1 month lead over the changes in both the US Dollar and the EUR (see the second chart of the week). The gold-silver ratio has a long way to go to yield a significant signal of a turnaround in the precious metals sector, but what we got two weeks ago is a very good start. On a fundamental basis, silver may outperform gold on the acceleration of global growth. Silver is indeed more cyclical than gold due to its more extensive industrial use (photovoltaic, water purification, electronic components,...). On the other hand, the stronger global growth may mitigate the impact of the weaker US Dollar on gold prices, leading to the underperformance of the yellow metal against more cyclical precious metals — palladium and platinum may also outperform gold.
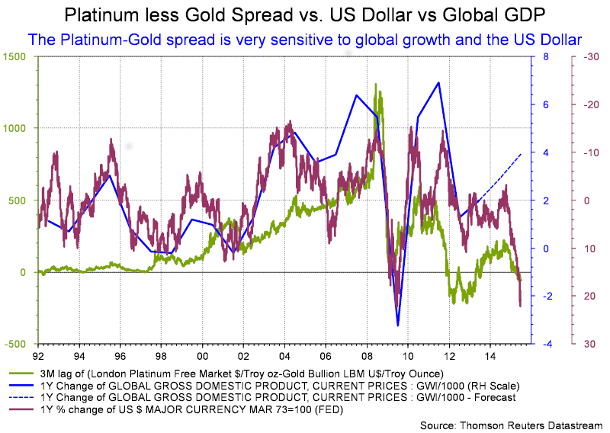
There are indeed still some issues with the platinum-gold spread. The ratio closed last week at a $43 premium for gold over platinum. This is an unnatural state for this price relationship — platinum is more than ten times rarer than gold (platinum production is 11 times smaller than gold production) and should trade at a premium to the yellow metal (see the third chart of the week). Until the ratio comes to par, or better, for platinum to move into a premium position, the outlook for the Precious Metals Group remains uncertain. Global platinum was in deficit last year of around 700 thousand ounces according to a report issued this month by the newly formed World Platinum Investment Council (WPIC). However, above-ground stocks held by producers, comfortably made up for the short-fall. The WPIC sees reasons for higher prices on the back of robust demand and a tightening supply market, a market which — it must be said — remains in deficit, but this may not feed through into higher prices much before 2016/17 when the HSBC bank sees prices potentially exceeding $1,700/ounce. Platinum may hence also do well within the precious metals sector. The most cyclical precious metals are therefore likely to outperform gold prices on the probable US Dollar weakness and especially with the acceleration of the rest of the world (relative to the US) and the decline of the risk-off environment. Consequently, after a first downward move the gold-silver ratio should carry-on further.
 |
Commodities and Economic Highlights:
|
Commodities and Economic Highlights
Commentary by Alessandro Gelli
How fast can Iranian crude oil exports rebound if a nuclear deal is reached?
International sanctions imposed on Iran have contributed to reduce the country’s crude oil production from about 3.8 million b/d in 2010 to 2.8 million b/d. This 1 million b/d decline in production translated into a similar decline in crude oil exports, now estimated at around 1 million b/d. The international sanctions have been imposed in order to bring Iran at the negotiation table. Negotiations have progressed significantly and an agreement could soon be reached. In fact, Iran and western countries have agreed on the nuclear aspect of the negotiations. The only issues remaining are on how fast the international sanctions will be removed and how fast Iran will implement the agreed measures.
The removal of international sanctions would also allow Iran to export a greater amount of crude oil. But how fast can this occur? The Iranian government said that once sanctions are removed they want to increase crude oil production by 1 million b/d back to pre-sanctions levels. But it could take few months to restart the old oil fields. The reservoirs’ pressure may have been negatively affected following the shutdown. This could especially affect the flow of Iranian crude oil, which is typically heavy and may prove more difficult to restart. Foreign investment and expertise may be required to restore output at pre-sanctions levels. A former official at the National Iranian Oil Company recently said that Iranian crude oil production could rise between 500’000 and 800’000 b/d within three to six months. Furthermore, the final agreement may only lead to a gradual removal of the international sanctions preventing Iran from increasing crude oil exports significantly over a short period. Thus, the revival of Iranian crude oil exports is facing two constraints: physical and legal constraints.
The legal constraints could especially affect the 12 million barrels of Iranian crude oil stored in tankers. If sanctions are removed, this crude oil would thus be available. Following the possible political agreement in March, Iran and the P5+1 countries have to agree on a technical deal by the end of July 2015. The sanctions could gradually start to be removed from this period onward. The return of Iranian crude is not likely to be significant until at least the beginning of 2016.
Grains are approaching oversold conditions amid higher supply risks
Grains prices have reached a year-low in mid-March 2015, due to the strong US Dollar and weak sentiment on the sector. However, grains prices are approaching oversold conditions. Two weeks ago, net long speculative positions on grains futures have fallen to the lowest level since at least 2006, when the disaggregated data started. On soybean, net long speculative positions have declined to the lowest level since October 2006. On wheat, net long speculative positions are back to the low levels reached in September of last year. On Corn net long speculative positions decreased to the January 2014’s low over the pessimistic outlook. Market participants are expecting important crops amid elevated inventories, leading to the decline in grain prices to levels close to the lows of 2009. Grains are therefore showing signs of oversold conditions, while the decline in prices has increased supply risks.
Grains prices fell close or below production costs, discouraging spending. Farmers are likely to spend less in equipments and fertilisers, increasing the supply risk. Grain prices have fallen below or closer to the average spending in the US. Average spending for soybean in the US Midwest is at $10.1 a bushel, while last week prices stood at around $9.8 a bushel. On the other hand, corn prices stood at around $3.8 per bushel, compared with an average spending to grow corn in the Midwest estimated at $4.6 per bushel, a difference of $0.8 per bushel. This could significantly reduce farmers’ incomes. According to the USDA, US farm income should decline by 32% y/y in 2015 to $73.6 billion.
As a consequence, US farmers are likely to spend less for their crops. This should lead to a significant reduction in expenses in fertilisers and equipments, which may put yields at risk. Deere, the provider of agriculture equipment, has forecasted a decline of 17% of net sales for 2015. Low prices have therefore increased the risks on crops.
Charts of the week: Gold/Silver ratio may soon return back to the historical average
|
The gold/silver ratio rose recently to high level and is on track to move back to its historical average driven by a weaker US Dollar and stronger global growth. |
|
|
For the full version of the Diapason Commodities and Markets Focus report, please contact info@diapason-cm.com