
March 2, 2015
The US Dollar rally losing steam; and signs of a transition towards a risk-on environment are slowly becoming more apparent
Commentary by Robert Balan, Senior Market Strategist
"The US dollar is surging and export growth is slowing. The same applies to the widely forecast stampede of reshoring to the country, which is not really happening. Most US competitors are cutting interest rates and watching their currencies fall against the dollar. If these trends persist, and they will, US politics will react. A rising dollar is not the picnic it is made out to be.”
Edward Luce, The perils of a strong US Dollar, Financial Times, February 1st, 2015
The US Dollar progression has stalled last month. This contrasted with the almost 20% non-stop rise since June 2014. This is telling us that some of the rally’s drivers are losing steam. The factors which have contributed to the strength of the greenback are becoming more priced-in, while other elements are indicating that the US Dollar may not be far from a significant and lasting correction. If a Dollar pullback gains ground, this could in turn benefit commodities.
Last month the US Dollar has appreciated at the slowest monthly pace since the rally started at the end of June 2014. The Dollar Index, which tracks the US Dollar’s move against a basket of currencies rose by only 0.5% in February, compared with an average monthly appreciation of between 1.1% and 4.5% between July 2014 and January 2015. The US Dollar rally lost momentum following the ECB announcement of the new European QE program. Moreover, many observers claim that the US Fed is getting closer to a rate hike (probably in June), which in principle should lead to further appreciation of the greenback. However, as we noted in a recent report, these elements are all old news — the market has already discounted these elements since the start of the year, after a circa 20% rally. The European QE program only confirmed what was already priced-in. This may lead to a buy-the-news, sell-the-fact situation.
Those factors may not have been the only drivers behind the recent US Dollar’s strength. Another factor, which may have been overlooked, is money creation in the US. According to the Quantity Theory of Money, more supply of money lowers the value of the currency. Credit creation operationally increases endogenous (transaction) money and monetary aggregates, so more credit creation tends to weaken the US Dollar. The recent strength of the US Dollar is perhaps in large part a response to a strong decline in credit creation in the past two quarters, which we are not seeing because most of it has not been reported yet. The fall in credit creation was likely the commercial banks' response to recent decline in long term rates and the narrowing of the term spreads. Narrower term spreads constricts the banks' Net Income Margin, which makes lending relatively unattractive.
Another factor of the appreciation of the US Dollar since the middle of last year was the risk-off and disinflationary environment, which was reflected by the outperformance of defensive US equity sectors over cyclicals sectors, and in the decline in US 5y and 10y breakevens. This added to the allure of US treasury bonds as safe-haven assets, leading to stronger US Dollar and at the same time lower yields. This may also explain the good performance of gold prices between November 2014 and January 2015, as negative yields made the yellow metal attractive as an alternate safe-haven asset.
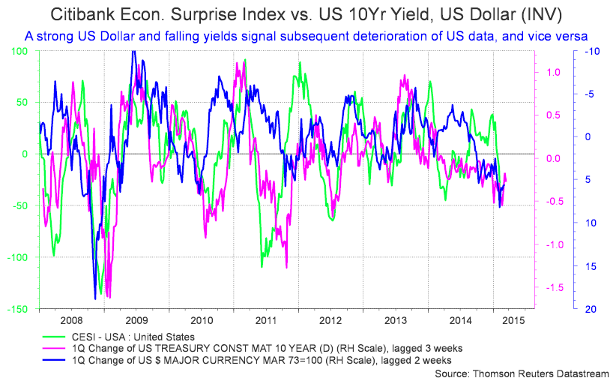
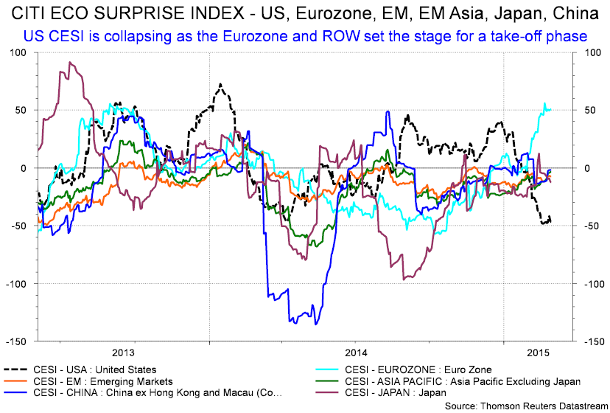
But this risk-off/ disinflationary environment may end in the near future as suggested by the recent reversal of these factors. US breakevens and the cyclicals-over-defensive ratio have stabilised since the end of January amid falling volatility in the stock markets — as reflected by the fall of the VIX. This possibly indicates that we are getting closer to the return of a risk-on environment or at least the last phase of the risk-off mode. The decline in gold prices and the rebound in US 10-year Treasury yields from 1.6% at the end of January 2015 to above 2.0% in the second half of February also suggests declining demand for safe-haven assets. It is interesting to note that this occurs even as the Citi US Economic Surprise Index falls sharply, projecting a likely slowdown in the economy in the near-future (see charts of the week).
The deterioration of the economic activity in the US may continue as employment growth slows, following the oil crash, which resulted in sizeable lay-offs in the energy sector, and the strong US Dollar, which has negatively affected the exports industry. Economic surprises in Europe and in East Asia serve as counterpoint to the US data weakness (see charts of the week). A narrowing of the growth differential between the US and the rest of the world could trigger a depreciation of the US dollar. However, the risk-off period may not be totally over. Demand for gold and US Treasuries could be reignited due to the uncertain situation in Greece, growth concerns in China and in the US, leading to one last period of defensive sectors’ outperformance over cyclicals, and US Dollar appreciation. Improving economic conditions in Europe and Asia are then likely to be more apparent in Q2 2015. Cyclical commodities such as base metals and energy may therefore benefit from what we expect to be the return of the risk-on environment and a significantly weaker US Dollar by late Q2 2015. Our expectations are for the rest of the world to outperform the US growth during the second part of this year, along with a falling US Dollar and rising commodity prices.
 |
Commodities and Economic Highlights:
|
Commodities and Economic Highlights
Commentary by Alessandro Gelli
Record low temperatures are not sufficient to lift US natural gas prices significantly
The US has experienced one of the coldest February in decades. Chicago experienced its third coldest February, slightly behind the second coldest set during February 1936. Moreover, the US East Coast faced the coldest February on record. Nonetheless, US natural gas prices rose by only 1.6% over February and remained below $3 per million Btu and down by more than 50% from February last year. The natural gas price rise appears mild relative to the temperatures.
However, at the end of the 2014 injection season (in early November), US natural gas inventories were down by 6% from the 5-year average, while two weeks ago it was 5% above the 5-year average. The level of inventory, which was in a deficit compared to previous years, is now in a surplus relative to historical levels for this time of the year. Average weekly withdrawals from inventories stood at 94 billion cubic feet compared with the 119 billion cubic feet average for the past five years. This occurred despite strong demand for natural gas due to cold weather, and despite the 21% decline in US natural gas rig count since early November 2014 to 280, the lowest level since 1993. The number of rigs in the Marcellus Basin, which accounted for 79% of US shale natural gas supply growth last year, fell to 68, the lowest level since data started in 2011 (-19% since early November 2014). The reduction in rig count may not affect production in the short run — there is often an important backlog of shale wells waiting for hydraulic fracturing or to be connected to the pipeline network. However, this could give hints of future supply growth.
The recent weak inventory withdrawal of natural gas was indeed caused by strong natural gas production growth. According to the EIA, US natural gas production rose by 7.5% y/y in January 2015. This follows strong growth in Q4 2014, with an average annual growth of 7.9%. Preliminary data also show strong supply growth for February. This should limit significantly the upside potential of US natural gas prices if another cold wave hit the US. As in oil, the weakness in natural gas prices is really supply-driven. Production growth hence needs to slow down significantly to see a sustained recovery in prices.
The US refinery strike increases products supply risks and keep crack spreads elevated
The largest US refinery strike since 1980 has entered its fifth week. 6’550 members of the United Steelworkers union (USW) at 15 plants, including 12 refineries are seeking more pay, to replace non-union contractors with union workers and other benefits. Shell, which represent the oil companies, have yet to find an agreement with the USW. This has contributed to keep US crack spreads at a high level even for the season. The refining maintenance season has just started for the US Gulf Coast. This typically support higher crack spreads.
However, crack spreads are now at a higher than normal level due to the strike but also because of the extremely cold weather, which hit most parts of the US these previous weeks and threatened operations at refineries. Relatively strong demand for petroleum products also contributed to the elevated crack spreads. According to the EIA, US implied petroleum products rose by almost 5% y/y since the beginning of the year, encouraged by low prices and the improving economic conditions in the US. The strike from refiners in fact did little to disrupt refining activity for now. Indeed, only Tesoro’s Martinez refinery in California was shut down as half of the refinery was already performing planned maintenance before the strike. The other refineries continued to operate as non-union workers and managers trained for months ahead of the strike and replaced the union workers as soon as the strike began. While refining activity has yet to be significantly affected by the strike, crack spreads have been supported by the growing risks of unplanned outages at refineries due to the fact that inexperienced staff are running these facilities. Moreover, this has been amplified by the fact that the refining maintenance has started, reducing operable capacity to respond from unplanned outages. The refining industry is therefore significantly less flexible during the turnaround season and the strike increases the vulnerability of the industry. The US petroleum products market, and especially gasoline, remains also under pressure following explosion at Exxon’s Torrance refinery in California on February 18th, reducing gasoline supplies for the West Coast.
The downside risk on crack spread is nonetheless important due to the possible conclusion of an agreement between Shell and the USW at some point. This could lead indeed to lower crack spreads. The downside would be however capped by the refining maintenance season, which should last until the end of April in the US.
Charts of the week: Citi Eco Surprise Indices US vs the rest of the world
|
A stronger US Dollar signals a subsequent deterioration of US data as reflected by the lower Citi US Economic Surprise Index, which contrasts with rising economic surprises in the rest of the world. The growth differential could in turn lead to a weaker US Dollar. |
|
|
For the full version of the Diapason Capital Markets report, please contact info@diapason-cm.com