
February 23, 2015
Oil still looking for equilibrium; prices could face another pull-back
Commentary by Alessandro Gelli, Commodity Analyst
"Brent prices have benefited a bit from Libyan and Iraqi pessimism, but if stocks continue to amass, particularly Libyan problems will weigh light.”
Samuel Ciszuk, Swedish Energy Agency, February 18th, 2015
Oil prices rose by more than 20% since the January lows, following announcements of major capex cuts, the significant decline in US oil rig counts and supply disruptions in the Middle East. However, the oil glut has not disappeared. While the oil balance could move back to equilibrium by the end of the year, the oil surplus and the recent start of the refining maintenance season are contributing to rapidly growing oil inventories. Front months are likely to be the most at risk by the ongoing build-up in crude oil inventories, while more distant maturities could already start being supported by the anticipation of the return of a more balanced market in the second half of the year.
Following an almost 60% decline since June 2014, Brent price rose since mid-January by 26%. The foundations of the price rally were mostly signs of adjustments from the supply-side. The number of US oil rigs fell by 34% since mid-October 2014. The pace of the rig’s weekly decline even accelerated in January. This was the most rapid decline ever recorded since at least 1987 when the data started. Oil companies have also announced significant reduction in expenditures in response to the low oil price environment. The combined layoffs announced by the top three oil services companies (Halliburton, Schlumberger and Weatherford) were 23’400, accounting for almost half of the expected layoffs caused by the decline in oil prices (about 50’000 workers). RBC Capital markets also estimated a cut in capital spending by 20% ($86 billion) for 2015, driven by exploration & production companies (-31% y/y or -$52 billion). These cuts resulted in the cancellation or delayed oil projects, reducing the medium-term supply growth outlook. This had a positive impact over the entire forward curve.
Meanwhile, front maturities on oil futures recently benefited from short term factors, which contributed to a significantly narrower contango. Supply disruptions in the Middle East and North Africa indeed contributed to the outperformance of front months. Iraqi crude oil exports have slowed down significantly in February, due to bad weather, to 1.8 million b/d in the first 19 days of the months, compared with 2.4 million b/d in January 2015. This comes on top of further tensions between the federal government in Baghdad and the Kurdistan Regional Government. Last week, the latter threatened to halt crude oil exports (estimated at around 350’000 b/d) as it did not receive oil payments promised by Baghdad. Furthermore, Libyan crude oil production has fallen to about 250’000 b/d last week, down from 360’000 b/d in January 2015 and from 900’000 b/d in October 2014.
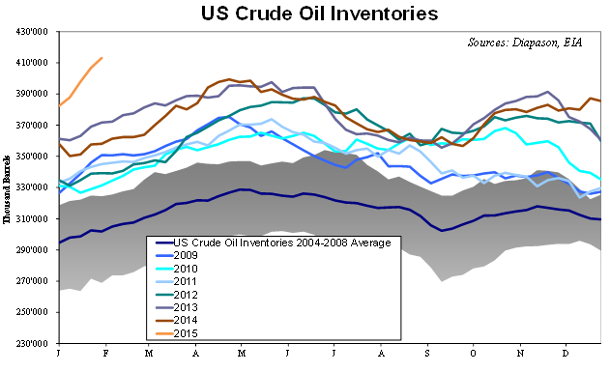
These factors however are insufficient to support a sustained rebound in oil prices. Indeed, while crude oil production in Iraq and in Libya is likely to remain volatile, Saudi Arabia is ready to pump more oil. According to energy consultancy PIRA, Saudi crude oil production has recently increased to about 10.0 million b/d, up from 9.6 million b/d in January 2015. Moreover, oil inventories are likely to rise further to new record high. Inventories tend to increase seasonally until at least May, due to the refining maintenance season. The oil surplus has led to a faster than usual build-up in crude oil inventories. Two weeks ago, US crude oil inventories rose to 425.6 million barrels, up 18% y/y and up by 21% from the 5-year average, while they stood close to the 5-year average at the end of September 2014. The faster than normal build-up in crude oil inventories could continue until crude oil supply growth slows down significantly. US crude oil production is expected to grow further albeit at a slower pace in the coming months, despite the sharp reduction in oil rig count and the large cuts in capital spending. The US government expects domestic crude oil production to peak only in May 2015 and then decline by 100’000 b/d until December 2015. US crude oil production could reach 9.2 million b/d in December 2015, up by only 300’000 b/d y/y, a significantly slower growth than in December 2014 of 1.2 million b/d y/y.
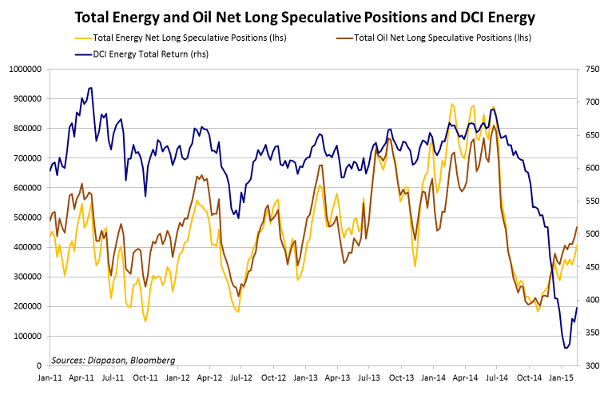
The combined oil surplus and the refining maintenance season are contributing to a rapid rise in crude oil inventories, which could at some point increase worries about onshore storage capacity. This could add downside pressure on oil prices, especially on front maturities. This may also retest long speculative positions, which have been increasing these past few weeks. Low oil prices have indeed contributed to the rise in net long speculative positions by 25% since the beginning of the year, to the highest level since the end of July 2014, when Brent was still trading above $100 per barrel. Large inflows into oil ETFs are also indicating that retail investors have built long positions as they are anticipating a rapid rebound in oil prices. Downside risks are especially important on front maturities, while more distant futures contracts should do better, keeping crude oil in contango.
However, this correction could offer interesting entry opportunities to build long positions as oil prices are unlikely to remain at low levels for long. The oil market is indeed likely to tighten in the second half of the year and could even return to equilibrium by the end of the year. Oil prices are likely to rise ahead of the onset of a tighter oil market looking for an equilibrium, which is probably higher than current levels (see Commodities Insight Weekly, 2015 commodity outlook: when could oil prices anticipate a more balanced market?, January 26th, 2015).
 |
Commodities and Economic Highlights:
|
Commodities and Economic Highlights
Commentary by Alessandro Gelli
Copper: supply disruptions more than offset weak real restate conditions in China
Since the beginning of February, base metals prices have experienced a downward move triggered by concerns over the Chinese economy amid the persisting disinflationary and risk-off environment.
In January, real estate prices fell again in 69 Chinese cities from a year earlier, compared to 68 the previous month. This was the ninth straight month of decline. Property prices fell by 3.2% y/y in Beijing and by 4.2% y/y in Shanghai. This was naturally a cause of concerns for base metals as real estate accounts for a large share of most base metals. It was however interesting to notice that the best performer among base metals month-to-date was copper, which has strong ties with the real estate sector. Indeed, the latter accounts for about half of Chinese copper consumption. In fact, copper benefited from an important supply disruption, which more than offset the negative Chinese data.
At the end of January, an electrical failure forced BHP Billiton to halt operations at its Olympic Dam mine in Australia. Repairs that should last 6 months at the largest processing mills could reduce the mine output by 70’000 metric tons of refined copper. This is significant as the copper surplus was estimated at about 120’000 metric tons before the operations were cut at this mine, which is the world’s 18th largest copper mine. The copper surplus could therefore already be significantly smaller than initially expected. This contributed to the significant outperformance of copper prices against other base metals. Month-to-date LME copper price is up by 3.6%, while other base metals showed negative returns ranging between -3.9% and -8.1%.
The good performance of copper could also be attributed to the fact that copper prices have fallen to very low levels at the end of January 2015. Copper prices broke the $5’500 per metric ton levels, following the significant 33% rise in copper inventories at major exchanges in January alone. Copper have recovered and stabilised at around 5’650 per metric ton, while other base metals prices fell during most part of the month. However, this should not last as the copper surplus is likely to be confirmed throughout the year due to the start of new mines. Moreover, copper inventories continue to build-up at a rapid pace, implying a surplus. Copper outperformance may not last. Zinc and aluminium could therefore soon take back the leadership position among base metals.
US farmers are reducing overall planting, but soybean remains attractive
Low prices are encouraging farmers to reduce planting. At its annual Agricultural Outlook conference, the USDA presented its forecast for 2015. The US agency expects total acreage for the eight major crops (corn, soybeans, wheat, cotton, rice, sorghum, barley and oats) to decline to 254.6 million acres, down 3.3 million from last spring and the lowest since 2011. This is following consecutive record crops that negatively affected margins and have hence discouraged planting.
The USDA also expects grain prices to decline further. Corn prices should decline to $3.5 per bushel, down 4.1% y/y and the lowest level since 2006. Soybean prices could also drop by almost 12% to $9.0 per bushel, the lowest in 9 years. According to the USDA, this should contribute to reduce the soybean planting area by 200’000 acres y/y to 83.5 million acres. This contrasts with previous years, when US farmers increased the overall planting area in order to cash in on high agricultural prices, which in turn contributed to consecutive bumper crops.
However, this is well below market expectations. Indeed, low operating costs for soybean have increased the crop attractiveness relative to corn. Soybean prices have also remained close to the total cost of production. Average spending for soybean in the US Midwest is at $10.1 a bushel, while last week prices stood at around $10.0 a bushel. On the other hand, corn prices stood at around $3.9 per bushel, down by $0.7 from the average spending to grow corn in the Midwest estimated at $4.6 per bushel. This is why most consultancy firms expected a relatively large rise in soybean acreage at the expense of corn, similar to that in 2014 when corn planting fell by 5% while soybean planting rose by 9%. The USDA may be underestimating the possible corn-to-soybean switch in area planting. In order to limit losses, farmers may prefer to keep overall planting stable and replace corn by soybean. This could in turn have a positive impact on corn prices, which remain close from the four-year low made in October 2014 at $3.2 per bushel. Corn prices could therefore outperform soybean prices this year.
Charts of the week: US crude oil inventories / Net long speculative positions
|
US crude oil inventories are rising at a more rapid than usual pace for the season due to the oil glut. Concerns about storage availability should gradually increase, adding further downside pressure on oil prices. The possible oil price correction could wash out the long speculative positions that have increased these past few weeks. |
|
|
For the full version of the Diapason Capital Markets report, please contact info@diapason-cm.com