
October 6, 2014
The gold/silver ratio reaching elevated levels
Commentary by Robert Balan, Senior Market Strategist, Alessandro Gelli, Commodity Analyst
“Gold plummeted to $US1204.75 per ounce Wednesday, but is still trading at 71 times silver's value. Historically this is quite high: the 10-year average is 57.75. The last time silver was below $US17 was March 2010.”
Stephen Cauchi, The Sidney Morning Herald, October 1st, 2014
An ounce of gold can now be used to buy more than 70 ounces of silver. The gold/silver ratio hence reached the highest level since February 2010 and is 21% above the 1975-2014 average of 58. The gold/silver ratio has increased greatly these past few months up from 60 at the beginning of the year. The ratio reached an elevated level due to the stronger US dollar and slower economic growth. However, we expect the US dollar to weaken while, at the same time, global economic activity, driven by China, should start to accelerate (See Diapason Commodities Insight Weekly “Chinese monetary, not fiscal, policy is key to future growth”, September 29th, 2014). This should lead to a phase of silver outperformance over gold prices.
The recent upward move of the gold/silver ratio has been triggered by two factors:
Firstly, the tighter monetary conditions contributed to the outperformance of gold over silver. The ratio is indeed strongly influenced by monetary conditions. This is reflected by the strong links between gold prices, the US dollar and real interest rates (see chart of the week). An important rise of the gold/silver ratio typically reflects rapidly growing credit/market risks. Following the Lehman’s crash, the ratio rose sharply above 80 as gold outperformed silver, reflecting extremely tight monetary conditions at that time. In 2011, the QE2 program contributed to greatly ease monetary conditions, leading to a sharp decline in real interest rates, a weaker US dollar, higher inflation expectations and a significant outperformance of silver against gold. Tighter monetary conditions tend to add upside pressure on the gold/silver ratio through lower inflation risks. Lower inflation typically implies a higher value of the currency and slower economic activity. Both gold and silver suffered from the former, while the latter has a larger impact on silver prices due to its stronger link with the industrial activity. Silver is a key component for electronic materials. In 2014, the tighter monetary conditions in the US — and growing market’s expectations of a rise in Fed funds rate in 2015 — as suggested by the rise in real interest rates and the stronger US Dollar, contributed to an important reduction in inflation expectations and led to the underperformance of silver against gold prices.
Secondly, the recent slow down in economic activity in Europe and in Asia contributed to the underperformance of silver against gold through reduced industrial demand for silver — and growing deflation worries in Europe. On the other hand, gold — which is a pure safe-haven asset — may have benefited from the more important concerns on growth in these regions.
While monetary conditions in the US could tighten further, financial easing is growing in the rest of the world. The new ECB’s asset purchase program — an European QE — and the recent reinforcement of the Chinese standing lending facility, which already provided 500 billion yuan to the 5 largest Chinese banks — a Chinese QE — should more than offset tighter monetary policy in the US. This should hence lead to an easing in global monetary conditions. This should also contribute to an acceleration of global growth, adding downside pressure on the US dollar. These factors could therefore trigger the outperformance of silver over gold.
Moreover, the sentiment on both gold and silver has reached extreme lows. Net long speculative positions on gold have fallen sharply to their lowest level since January 2014. On silver, the amount of short positions is close to the record high level reached in June 2014. The positive sentiment on gold also fell to the lowest level since the beginning of the year. On silver, the positive sentiment dropped to the lowest level since July 2013, indicating a more important negative sentiment on silver than on gold. The potential for a short-covering rally therefore appears more important on the silver than on the gold market. Furthermore, gold prices are down 36% from their peak, while silver prices are down by 65% from their all-time highs. This implies that silver may have little room to fall significantly further especially against gold. The ratio, which has stretched to elevated levels, could soon fall back closer to historical norms.
 |
Main drivers this week
|
Commodities and Economic Highlights
Commentary by Robert Balan and Alessandro Gelli
Gasoline’s outperformance should not last
During the past two weeks, the gasoline market experienced unusually important price moves for this time of the year. Front contracts increased significantly against more distant maturities, leading to a significantly wider backwardation. Gasoline crack spreads rose at a rapid pace before falling abruptly. The gasoline-Brent spread on the November maturity rose to $10 per barrel in the third week of September from about $5 per barrel at the beginning of the month. The crack spread then dwindled to around $8 per barrel at the end of September. The spread between gasoline and heating oil prices also experienced large movements. This kind of price moves in the gasoline market typically occurs during large supply or demand shocks such as that caused by the hurricane Sandy in 2012. This hurricane damaged the petroleum infrastructure in the US East coast, contributing to a spike in gasoline prices.
The recent outperformance of gasoline prices was caused by a combination of several factors. Firstly, unplanned outages at several important refineries contributed to reduce gasoline supply, while other refineries were performing maintenance work. Two fluid catalytic crackers (FCC) — used to maximise gasoline output— at Exxon’s 344’000 b/d Beaumont refinery in Texas were shut for unscheduled repairs in mid-September. Soon after, FCC units in two other refineries on the US Gulf Coast were shut down or forced to work at reduced rates. Secondly, the extreme movements in gasoline prices were amplified by two elements: US gasoline inventories stood at a relatively low level, down about 3% y/y and slightly below the 5-year average and the amount of short speculative positions on gasoline futures had reached record levels, implying oversold conditions.
Following the rapid upward move on the third week of September, gasoline spreads consolidated while remaining close to elevated levels. This should not last as the physical market is responding to these signals. Indeed, the important outperformance of US gasoline prices opened the arbitrage window with Europe, leading to a 70% increase in cargoes sailing to the US from Europe since August when US demand peaks. This is unusual for this time of the year. But this contributed to help margins at European refiners. The more elevated refining margins should also encourage the US refiners remaining active to boost their gasoline production. Moreover, global planned refinery outages are expected to peak in the first part of October. Refining activity should hence gradually increase, leading to higher gasoline supply, while US gasoline demand is declining seasonally. Thus, downside pressure on gasoline spreads is becoming more important and should prevent gasoline from outperforming the oil complex further. Heating oil prices are likely to take the lead within the oil complex due to seasonally stronger demand, low inventories and the likely acceleration of the global economic activity in the fourth quarter.
Downside appears limited for nickel prices
In contrast to their performance in the first part of the year, nickel prices lagged the base metals sector in September. Despite the Indonesian ban on ore exports, LME nickel inventories expanded at a more rapid pace in September to a new record high level, decreasing concerns about shortages in the short run. LME nickel inventories rose by 8.3% in September. They are up by 36.3% since the beginning of the year.
Indeed, while the nickel market is expected to move into a large deficit next year due to the ban, weaker Chinese demand and unexpectedly strong supply from the Philippines have contributed to the temporary weakness in nickel prices. LME nickel prices fell by almost 13.3% in September as concerns about a possible ban on ore exports from the Philippines faded. Following the implementation of the Indonesian ban on unprocessed ore exports at the beginning of 2014, the Philippines replaced Indonesia as the main provider of nickel ore for Chinese smelters. The nickel ore is used to produce nickel pig iron - a cheaper substitute for refined nickel.
Despite this short term weakness, nickel prices aren’t likely to decline further significantly. Demand for nickel should recover as we expect an acceleration of the Chinese economy in Q4 2014. Moreover, on the supply side, the stronger output in the Philippines may not last as nickel producers are suffering from lower prices. Nickel prices have indeed declined to $16’500 at the end of last week, below the marginal cost of production, which is estimated at around $18’200 per metric tonne. Some producers could therefore reduce output, preventing nickel prices from declining further significantly.
China is unlikely to restrict soybeans import like it did for corn
Since November 2013, China has been rejecting US corn shipments due to the government’s tougher stance on genetically modified organism (GMO). In July 2014, China extended the ban on US dried distillers grains with solubles, a by-product of ethanol production used as animal feed. This put a halt on the US corn exports to China. However, the ban was first interpreted as a temporary measure to boost domestic prices in order to help Chinese farmers, which experienced a record corn crop last year. The measures added downside pressure on US corn prices as China was the third largest recipient of US corn, accounting for 13% of total US corn exports in 2012/13, behind Japan and Mexico.
Two weeks ago, the Chinese Ministry of Agriculture rejected a cargo of genetically modified soybeans from the US, increasing concerns that China would halt imports of this particular type of GMO soybean and also that China may not lift the ban on US genetically modified corn any time soon. The official reason given was the “low public acceptance” of GMOs. This added downside pressure on soybean and corn prices due to the fear of a more extended ban on GMO soybeans.
However, the case of soybean is different from that of corn. Indeed, China wouldn’t be able to meet demand without US soybeans imports. According to the USDA, the Chinese soybean crop is estimated to decline next year to 12.0 million metric tonnes, the lowest level since 1992/93. On the other hand, domestic consumption should reach 85.0 million metric tonnes this year, up 6.1% y/y and a new record high. Imports are therefore expected to reach 74.0 million metric tonnes, up 7.3% y/y, about a third may come from the US. Moreover, Chinese inventories are currently only covering about 60 days of consumption, significantly less than between 2010 and 2012 when the stock-to-use ratio averaged 80 days. On the other hand, Chinese corn production — forecasted at 217 million metric tonnes — should be almost sufficient to cover demand — domestic consumption is expected to reach 220 million metric tonnes in 2014/15.
Thus, China isn’t likely to anger US soybean exporters by imposing restrictions on a certain type of GM soybean. The measure was probably an attempt to cancel orders as China purchased soybean last summer at too high a price. Two weeks ago, a Chinese trade delegation signed an agreement with US soybean exporters to purchase 4.8 metric tonnes of soybean, implying that China still needs US soybeans.
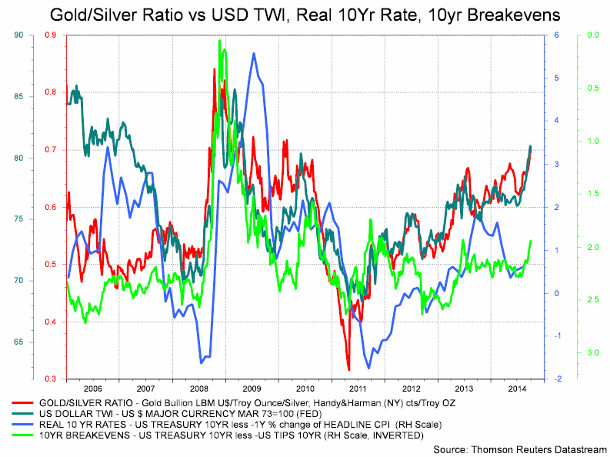
Charts of the week: The gold/silver ratio greatly influenced by monetary conditions
|
The gold/silver ratio is heavily influenced by the monetary conditions as reflected by its links with the real interest rate, the US Dollar and inflation expectations. |
|
|
For the full version of the Diapason Capital Markets report, please contact info@diapason-cm.com