
September 8, 2014
Roll yield contributing positively to commodities performance in 2014
Commentary by Robert Balan, Senior Market Strategist
"Today, many commodity forward curves are downward-sloping – a phenomenon known as backwardation. This has created a tailwind of positive roll yield, making it possible for investors to earn positive returns by simply holding commodities in their portfolios.”
Bransby Whitton, Kate Botting, PIMCO, August 2014
Commodity indices were created as far back as 1934 when Milton W. Jiler created the “Commodity Research Bureau” index based on spot prices. It took several decades for the commodity index industry to develop. It really started in 1991 with the advent of the “Goldman Sachs Commodity Index” and later in 1998 with the creation of the “Dow Jones AIG Commodity Index”, as commodity indices became investable, replicable and more representative of the current economic state. The major change from previous spot indices was the introduction of commodity future contracts as basis components, which integrated the exposure of the commodity index to the cost of carry and the convenience yield, specific features of the physical commodity markets. With the use of commodity futures, commodity indices have become a better reflection of the conditions of the physical commodity markets. When the delivery of a commodity doesn’t immediately take place, it is stored. The storage represents a cost, which includes the cost of storage, insurance and financing — also known as the cost of carry. The convenience yield is the premium associated with holding the commodity for immediate or short-term usage. This is having an impact on the performance of commodity indices through the roll mechanism.
The roll mechanism (holding a contract until it approaches expiry and selling it to buy the next one as defined by the index rules) generates a positive or negative performance called the “roll yield” or “roll return”. For a given commodity , the sign of the roll yield comes from the shape of that commodity’s forward curve. For instance, holding a commodity while its forward curve is in contango represents a cost as, if the shape of the curve does not move, the nearby contract’s positive spread to the spot price declines (eventually to zero) as time passes and it approaches expiry. The opposite is also true: in a backwardation environment, everything else equal, the contract’s price tends to move higher as it gets closer to delivery. This positive or negative yield is realized when the contract is sold, i.e. when it is rolled into the new one.
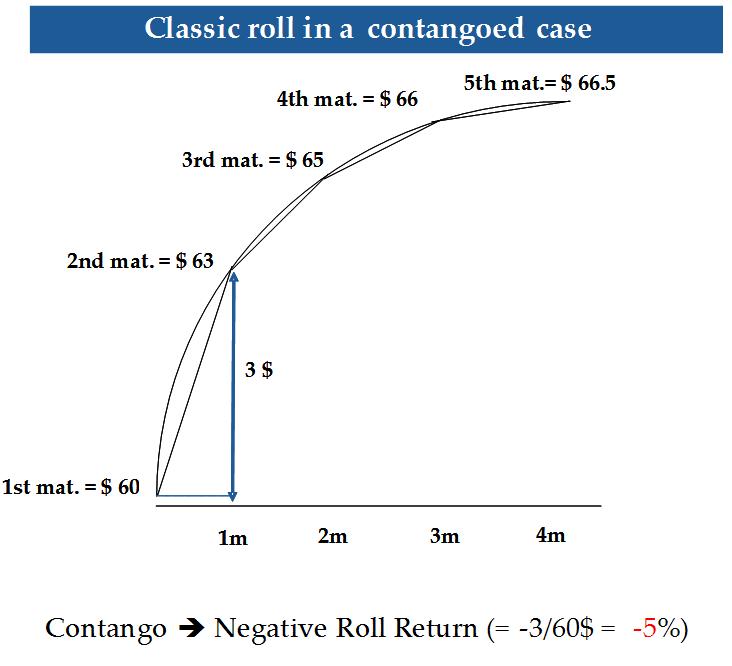
FIGURE 1 FIGURE 2
.jpg)
On FIGURE 1, an investor buying the 2nd maturity contract and holding it until it becomes the 1st maturity would risk losing $3 or 5% if the curve shape would remain stable over the period. On FIGURE 2, the same investor would be likely to gain $1.50 over the same period.
Moreover, the rolling process of commodity indices creates a supplementary pressure on commodity curves as an important selling and buying activity occur respectively on the expiring contract and new nearby one. For that reason, commodity index designers have spread the roll mechanism on several days. For instance, the Diapason Commodities Index®, which is composed of 47 commodities, is rolled over 3 days. On an index level, the roll yield is the aggregate of all the commodity roll yields, weighted according to the commodity exposure, for the whole rolling period.
Backwardation typically appears in a period when inventories are low, which implies a tight supply/demand balance — and hence a convenience yield higher than the cost of carry. This therefore leads to the outperformance of front maturities over the more distant ones. On the other hand, contango usually occurs when inventories are high, making stockpiling the commodity for future consumption profitable— as the price is higher in the future. The roll yield can work both ways for long-only commodity investor depending on market conditions. It can add a substantial performance to a commodity index in a backwardated environment (as it was the case in 2000, 2003, 2013 or more recently this year for the Diapason Commodity Index®) or severely impact the index performances in a contangoed environment. From 1998 to 2014, the yearly roll yields ranged from -26.4% to 11.0%.
Following several years of strong contango due to more elevated inventories for key commodities such as oil and copper, backwardation started to become more important by the middle of last year as inventories, which had increased greatly during the economic crisis, finally declined and moved back to pre-crisis levels. On the LME, copper inventories dwindled sharply since July 2013 and reached in Q2 2014 their lowest level since 2008. This contributed to bring a sustained backwardation environment on the LME copper since then. This is not an isolated case. OECD commercial crude oil inventories fell at the end of last year to their lowest level since 2007. Cocoa inventories are expected to decline this year towards their 2010 lows. Both inventory drawdowns contributed to a backwardated curve structure. Several other commodities saw a depletion of inventories, leading to a stronger backwardated environment or a diminution of the contango. This is contributing positively to the performance of the Diapason Commodity Index® (See Chart of the Week).
 |
Main drivers this week
|
Commodities and Economic Highlights
Commentary by Robert Balan and Alessandro Gelli
Speculative positions suggest oversold conditions in the oil market
Prices of petroleum products and crude oil fell significantly these past weeks. The $15 fall in the price of Brent, which started at the end of June was impressive (-12%), especially as it occurred during July and August, a period when the oil market usually tightens seasonally. These past three years, Brent prices increased by 9% to 28% between the end of June and the end of August. This year’s exception was caused by a weaker than expected oil demand due to the slower economic growth in Europe, the unexpected and rapid rise in Libyan crude oil production and a stronger US Dollar.
Another factor also played an important role: the sharp reduction in net long speculative positions on energy futures. These collapsed by 70% since the end of June — to the lowest level since July 2012. At that time, the oil market was about to recover from a $35 decline in oil prices — the price of Brent decreased from $125 per barrel in early April 2012 to $90 at the end of June 2012 — and a fall of net long speculative positions on energy futures of 63%. The amount of net long speculative position cut was also larger this year than in 2012 (-536’000 in 2014 vs -395’000 in 2012).
The downward move in speculative positions followed a record high level of net long speculative positions reached at the end of June 2014, indicating overbought conditions. Fundamental weaknesses then triggered the massive reduction in net long speculative positions, which had amplified the decline in oil prices. Low net long speculative positions are now suggesting oversold conditions in the oil market. Despite weaker seasonal support, improving fundamentals could still trigger a rapid and important rebound in the price of Brent. Indeed, in the second half of the year, the economic growth in the US and in China is expected to be more important. This should more than offset the impact of slower economic activity in Europe. Moreover oil supply risks remain important. For instance, Libyan and Iraqi crude oil exports look especially vulnerable due to the unstable political situation in these countries.
Nickel: the Philippines may follow Indonesia and ban
Last week, nickel was the best performing base metal due to increasing concerns over supply. The second largest supplier of the metal — the Philippines — may implement a ban on unprocessed nickel exports. This followed a 40% price rally since the beginning of the year due to the Indonesian ban on ore exports. Nickel prices reacted sharply as Indonesia is the largest exporter of nickel ore, accounting for 55% of global nickel ore exports in 2014. Moreover, Indonesian nickel was a key source of Chinese nickel pig iron used as a cheaper substitute of refined nickel.
The reduced availability of nickel ore has hence reduced the competitiveness of nickel pig iron, boosting demand for refined nickel. Chinese smelters still managed to replace some of the Indonesian nickel ore by nickel ore from the Philippines, which is the world’s second largest exporter of nickel ore, accounting for 43% of global nickel ore trade. The share of nickel ore imports from the Philippines to China reached 98% since May 2014, from an average of 40% in 2013, replacing Indonesian supplies, which accounted for almost 60% of total Chinese nickel ore imports in 2013.
However, this source of supply is now also at risk. A senator with family-ties to the Filipino president filed a bill last week to ban unprocessed ore exports. The intent is similar as in Indonesia as the proposed bill should encourage investment in processing facilities and increase exports of higher valued-nickel products such as nickel concentrate or refined nickel instead of the unprocessed nickel ore. The implementation of the ban could lead to reduced availability of nickel supply in the short run as it could take some time to build new processing facilities.
There are nonetheless some differences with Indonesia. International nickel prices have rallied sharply since the implementation of the Indonesian ban, leading to increasing profitability for nickel miners in the Philippines, while before the Indonesian ban on ore exports, Indonesian miners were suffering from low nickel prices — and encouraged therefore the ban on ore exports. Thus, there are less domestic pressures in the Philippines to implement the ban. While the political support for the bill within the Parliament remains unclear for now, the ban proposal still increases prospects of further supply tightness in the nickel market, adding upside pressure on prices.
The recent Cocoa price weakness may not last
Cocoa prices were among the best performing agricultural commodities since the beginning of the year. The December contract of the ICE cocoa futures is up by 16.7% year-to-date. However, it recently declined following the release of a report from the International Cocoa Organisation (ICCO), which estimated that the supply could increase by a larger than initially expected amount to 4.35 million metric tonnes, up 10.0% y/y. This implies that instead of a deficit the cocoa market is now likely to move into a surplus of 40’000 metric tonnes in the 2014-15 season. This was a major change as the industry association expected at the beginning of the year a deficit of 75’000 metric tonnes. This would have been the second deficit in a row as in 2013-14 global demand for cocoa outpaced supply by 154’000 metric tonnes and would have caused the global stocks to decline to 1.6 million metric tonnes, the lowest level in four years.
The upward revision of the supply outlook was caused by improved weather conditions for the mid-crop (April to September) in Ivory Coast and Ghana, which are accounting together for almost 60% of global cocoa production. The better than initially expected output could add some downside pressure on cocoa prices. However, the price consolidation may not last long as the ICCO still expects a deficit of about 100’000 metric tonnes for next year, driven by strong demand growth from emerging countries.
Moreover, another short term support is the recent drawdown in cocoa inventories. Last week, Cocoa inventories in warehouses monitored by LIFFE fell by 9.8% from the previous 2 weeks. This implies that the market is in deficit and could support prices. The harvest of the mid-crop in West Africa, which should end in October, could on the other hand lead to some further downside pressure in this period. This could provide interesting entry opportunities to benefit from the likely price rally, driven by the tighter 2015 cocoa market.
Chart of the week: Roll yield is moving into positive territories
|
The 3-month rolling roll yield of the Diapason Commodity Index® gives a clear summary of the historical situation of roll yields. Since mid-2004 until recently, commodity indices suffered from a negative roll yield due to a dominant contango. However, a clear trend of reduced roll costs appeared in 2010 as forward curves flattened and even switched to a backwardation shape. In 2013, the Diapason Commodity Index® experienced its first positive yearly roll yield in 10 years (+0.85%). As for 2014, it is even better: so far it brought +2.18% of additional performance. |
|
|
.jpg)
For the full version of the Diapason Capital Markets report, please contact info@diapason-cm.com