
September 1, 2014
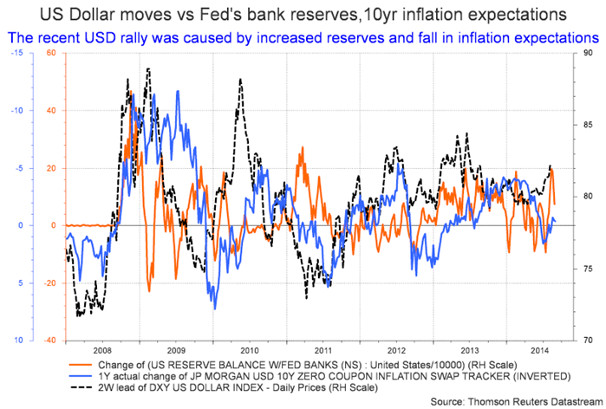
The US Dollar rally at an inflection point; bank reserves and inflation expectations could trigger a fall of the currency
Commentary by Robert Balan, Senior Market Strategist
"You hear a lot of concerns that it is time for us to exit, time for us to start thinking about leaving the zero lower bound and raising rates. But boy, it’s a mistake to go too early. And we should profit from the examples of other countries on that.”
Narayana Kocherlakota, Minneapolis Fed President, August 2014
The improved prospects for growth in the US has driven speculations that the Federal Reserve may exit its ultra-loose policy stance soon. This has led some to believe that 2014 might be the year when the US Dollar finally gets rid of its bear market shackles which has anchored it to the ground in the past 10 years. However, we believe that might NOT be the case — the calls are likely premature. The speculation that the Fed might be putting in place an exit strategy from its quantitative easing (QE) program during H1 2015 is powering arguments for a new US Dollar appreciation cycle. The prospects of the Fed reducing the massive overhang of bank reserves comes at a time when most other central banks are considering steps to further increase monetary accommodation. Being cited as precursor of US policy tightening is the tapering of QE3 purchases of $85 billion in US securities, which is expected to completely cease by October. The differences in growth prospects between the US and other major countries is also used as a rationale for a new US Dollar appreciation phase.
For us, these arguments seemed have helped the US currency rally over the past two months but are unlikely to alter the secular US Dollar depreciation trend, which been in place since the US President Richard Nixon terminated the convertibility of the US Dollar to gold, rendering the US Dollar a fiat currency, paving the way for the US Dollar to become the world's reserve currency, in lieu of gold. This aspect of the US currency as primary reserve currency has led to a structural decline in the value of the US Dollar — the simplistic mechanism is that if global trade expands, then the quantity of US Dollar has to expand, which lowers its value. These dynamics show up in the US current account balance, and eventually in the US Budget Balance as well. Innovations in these two mechanisms are the major determinants of US Dollar primary trends which arguably leads, and spans the US business and growth cycle. These US Dollar primary cycles take place within the purview of the broader, and still negative, secular trend.
Financial factors can of course also alter the course of the US Dollar in the short-term. That leads us to the recent sharp rally in the Dollar, which is generating all of these speculations of a regime-change. However, the causes of the recent US Dollar rally may be misunderstood. For one, the argument that tapering QE3 has been positive for the US currency is likely incorrect. The bullish outlook coming out of the tapering stems from the classic relationship between quantity of money and its price — more quantity, the lesser the price, and vice versa (with demand staying equal). However, as we pointed out in the last Diapason Commodities Insight (The impact of QE programs on asset correlations: VIX, Dollar and Commodities, August 25th, 2014), the relationship between the size of the Fed's balance sheet since the QE programs started in November 2008 and the US Dollar value has been POSITIVE rather than negative — the US Dollar has had taken more cues from the evolution of the bank reserves rather than changes in the Fed's fund rate, which is effectively zero-bound. It is easy to understand why — more bank reserves increase policy accommodation, which makes it more likely for growth in the US to take hold and to increase at a faster pace relative to the growth rates of other major economies.
That should put the termination of the Q3 program, likely to take place in October, in a different light. Cessation of further policy accommodation cannot be positive for the currency, especially in the backdrop of recent softer economic data out of the US. For instance, US personal spending fell 0.1% in July against expectations of a 0.2% rise. Personal income was also softer, rising only 0.2% against expectations of 0.4%. This is taking place as US headline and core PCE inflation rose 0.1% m/m and are now up 1.6% and 1.5% y/y, respectively. Inflation is rising while income growth is slowing, cutting down consumers' wherewithal to spend, and will impact future growth in significant ways. In a situation like this, the Fed's tapering is tantamount to a policy tightening, taking away the argument for further US Dollar appreciation. There is another major reason for a US Dollar weakness up ahead: the sharp collapse in FDIs into the US in recent months. This negative factor becomes manifest after a lag, but it just at this time that the impact of the sharply lower FDI begins to be felt by the currency.
But what did cause the US Dollar to rise sharply over the last two months? As far as we can see from the data, the recent sharp rally was caused by an unexpected rise in the level of bank reserves, and the fall in inflation expectations, the latter being a classic positive factor for the currency. The value of the US Dollar in the short-term is mostly a function of inflation discounts, which in turn is a function of inflation expectations.
The upward move in the US Dollar contributed to the recent weakness in commodity prices as they are heavily influenced by the US Dollar. The price correction in the energy and agriculture sectors was then amplified by the sharp reduction in net long speculative positions, which had previously hit elevated levels. However, the currency is approaching at that point of inflection among bank reserves and inflation expectations, which have earlier reversed course, and now signal a weaker currency. A weaker US Dollar should be seen sometime soon, probably even this week.
 |
Main drivers this week
|
Commodities and Economic Highlights
Commentary by Robert Balan and Alessandro Gelli
The global natural gas market could tighten further before the shoulder season
European natural gas prices have recently rebounded following an important decline in prices. ICE natural gas prices have indeed rebounded from its July low at 35 pence per term, the lowest level since April 2010 to above 40 pence per term. Prices have recovered despite elevated natural gas inventories in Europe. Eurozone natural gas inventories capacity utilisation reached 88.3% last weekend, the highest level since 2011. Slower economic growth and mild temperatures contributed to the decline in natural gas demand these past few months. The rebound in prices was caused by the tighter international natural gas market and fears of Russian gas cut during the upcoming winter. European natural gas prices for January and February 2015 have already increased by an important amount due to these fears. Western countries are hence likely to increase natural gas inventories as much as possible before the start of the winter, boosting natural gas demand. Another positive factor for European natural gas prices is the growing Ukrainian purchase of European natural gas as Russia cut its natural gas deliveries to Ukraine in June 2014. Ukrainian natural gas reserves are only half full (at 49.2% last weekend) and need to be filled before the winter when demand typically outpaces supply significantly. European natural gas inventory utilisation typically dwindles from around 90% in early November to less than 35% at the end of March. European natural gas prices also increased due to the lower availability of LNG cargoes caused by a tighter Asian market.
On the global natural gas market, price for LNG is increasing. In Asia, the price for LNG increased from $11 per million Btu at the end of July to above $13 per million Btu. Prices could increase further due to ongoing higher temperatures in Northeast Asia, which are boosting demand for power. LNG demand from Japan is also likely to remain at an elevated level as no nuclear reactors have been restarted yet. LNG imports in Japan already reached a record high level for the season in July. The start of a new LNG terminal in Hainan should also contribute to boost Chinese LNG imports in the coming weeks. Chinese demand for foreign natural gas is expected to grow at a rapid pace in the future as the government desires to move away from coal-fired power plants towards cleaner natural gas-fired electricity generation.
North-Asian LNG prices also increased due to stronger demand from Latin America. Indeed, the dry weather, which has hit Brazil, has contributed to lower hydroelectricity generation, leading to higher utilisation of alternative fuel for power generation such as natural gas. Global LNG prices could move higher in the coming weeks driven by the tighter market, adding further upside pressure on European natural gas prices. However, by mid-September, lower seasonal demand could ease the market, adding downside pressure on prices.
Copper should benefit from more supportive factors
The decline in copper prices at the beginning of the month was driven by lower Chinese imports data for July and renewed concerns about the property market in China. In July 2014, Chinese copper imports fell further to 340’000 mt (down 10’000 mt m/m), the lowest level since April 2013, down 110’000 mt from April. Copper imports also suffered from the tight credit conditions, following the metal financing probe at the Qingdao port. Moreover, weak arbitrage opportunities and physical premiums in April this year had a negative impact on these past two months’ copper imports as it usually takes 1-2 months to ship copper to China.
However, more supportive factors are appearing and are gradually becoming stronger, contributing to the recent rebound in copper prices. Demand for copper is increasing as suggested by higher copper premiums. The open arbitrage window between the SHFE and the LME is suggesting that Chinese copper imports could soon rebound from July’s low level. Copper inventories at major exchanges also declined since the middle of July, driven by the SHFE. They fell there by 26% since the beginning of August. This contributed to a stronger backwardation. The latter has been rising from its mid-July low. These factors are adding upside pressure on copper prices.
On top of this, the Chinese economic activity is expected to accelerate due to the mini-stimulus implemented by the government. This is likely to trigger stronger demand for copper in the coming months, while copper inventories at major exchanges are still down by more than 70% since the high of mid-2013, supporting copper prices. Copper prices, which have been lagging the base metals sector these past months, should therefore start to catch up with other industrial metals.
Deteriorating wheat quality could hit corn prices
European milling wheat prices could perform well despite a bumper wheat crop in Europe. This may seem strange at first but it could happen due to an important reduction of the wheat crop’s quality. Heavy rain in Europe indeed contributed to deteriorate the quality of the wheat crop, leading to a reduction in milling wheat output, while at the same time leading to an increase in feed wheat supply. The US wheat crop had already suffered from heavy rain in Q2 2014, leading to the outperformance of the Kansas wheat futures prices over the Chicago wheat futures prices. The latter cannot be used for milling due to its lower protein content and is hence used as feedstock instead.
Now it’s the turn of the European wheat to face growing quality concerns due to heavy rains. On the other hand, the decline in wheat quality in Europe implies ample supply of feed wheat, leading to lower prices for such quality. This could prompt stronger demand from Asian countries for feed wheat at the expense of corn, adding further downside pressure on corn prices. South Korea, which is the world’s third largest corn importer, is likely to increase its purchase of European feed wheat at the expense of US corn. South Korea’s corn imports typically purchase about 10 million tonnes of corn per year, accounting for 8% of global corn trade.
Furthermore, Chinese demand for European feed wheat may be even stronger than usual not only due to low feed wheat prices in Europe but because of elevated domestic corn prices in China. Corn is used as a feedstock and can hence be substituted with feed wheat. Chinese corn prices have indeed reached record high level in the first part of August — a massive divergence with US corn prices — due to the ban on some US corn and corn products such as dried distillers grains with solubles, which contained genetically modified strains. The ban may have been implemented due to the expected strong increase in domestic feed output. But local feed production may not be sufficient to meet strong domestic demand growth, increasing the likelihood of Chinese purchase of European feed wheat. This may however not be sufficient to prevent the underperformance of feed wheat against milling wheat. The Kansas-Chicago price spread may therefore rebound in the coming weeks. Wheat prices, and especially Kansas wheat, are likely to outperform corn prices due to higher feed wheat supply.
Chart of the week: Bank reserves and inflation expectations are suggesting a weaker USD
|
The unexpected rise in bank reserves and lower inflation expectations contributed to the recent strengthening in the US Dollar. However, these indicators have moved in opposite directions, implying that the US Dollar may have reached an inflection point and could soon move down. |
|
|
For the full version of the Diapason Capital Markets report, please contact info@diapason-cm.com