
August 25, 2014
The impact of QE programs on asset correlations: VIX, Dollar and Commodities
Commentary by Robert Balan, Senior Market Strategist
"The creation of money through these Fed asset purchases raises concerns about the stability of the dollar and the specter of an inflation spike in the future.”
Norbert J. Michel, Ph.D. and Stephen Moore, Quantitative Easing, The Fed’s Balance Sheet, and Central Bank Insolvency, The Heritage Foundation, August 14th, 2014
Unconventional monetary policies implemented by the US Federal Reserve since the end of 2008 could be considered as a game changer not only for the US economy, which managed to recover at a significantly faster pace than other countries — especially compared to Europe — but also for financial markets. Indeed, these measures have had major impact on the behavior of financial markets.
One of the most surprising aspect we saw is the apparent diminution of influence the Fed funds rate (FFR) has on the changes in the level of the US Dollar. Since early 2009, when the FFR was at zero-bound, and the Fed started to pay interest on bank reserves on October 2008, the evolution of the US Dollar TWI rate looks to have been influenced more by the bank reserves/bank credit created rather than by the policy rate. This poses some problems because there is a structural, negative correlation between the bank reserves and the FFR. The New York Fed say that "ceteris paribus, a higher (lower) supply of reserves is expected to be associated with lower (higher) rates in the federal funds market." The US Dollar has recently taken a strong bid in the wake of the rising level of bank reserves. This is counter-intuitive because normally higher quantity of "money" or "money-like" variables cheapens the value of the currency unit. But in this case, the higher levels of banks reserves may be analogous to increasing the level of accommodation, thereby increasing the chances of higher growth -- that is what may have provided the recent bid on the greenback. But this situation should change soon — we will discuss the dynamics which will tend to weaken the US Dollar next week.
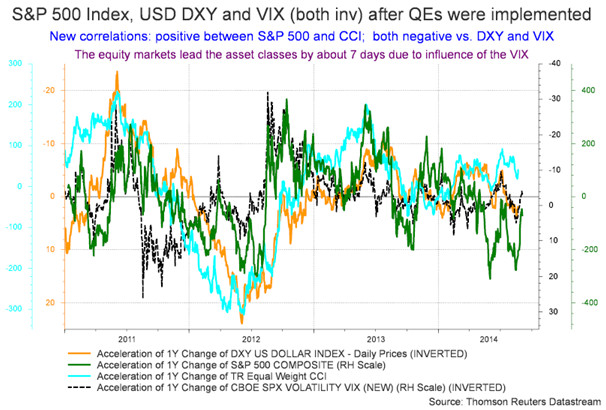
The USD-FFR altered correlation was not the only bizarre change that we have noticed in the correlation of the assets classes with each other in the wake of the massive generation of liquidity from the QE machinery. Another example is the correlation of the US Dollar and the equity markets. Prior to the Great Financial Crisis and the advent of Quantitative Easing (QE), the relationship between the currency and the stock market was generally off-and-on, to the point of becoming random for any given short period. But since the QE programs begun, the correlation between the US Dollar TWI and the stock market has become consistently negative. We believe we have found two likely links which explain the recent negative correlation: the VIX and long-term inflation expectations. We identified the sequence : changes in the VIX drive the changes in the stock price, and the changes in the USD TWI a week or so thereafter. The USD TWI, in turn, drives the changes in the CCI Commodity Index, which is also negatively correlated with the dollar. The net effect from the perspective of commodities: commodity changes have become highly positively correlated to changes in the level of equities, and by association, negatively correlated to the movements of the VIX. These relationships provide a sort of timing tool for commodities — the VIX is contemporaneous with the S&P 500, and both VIX and S&P 500 have a 7 to 8 trading days lead over commodities and the US Dollar (see Chart of the Week, below).
In these correlations, the VIX and the USD TWI are measures of over-all risks. The kind of risks that immediately comes to mind when hearing the words “VIX” and “US Dollar” in the same sentence are geopolitical and macro risks. We understand that the VIX rises during macro-volatility, leading the way to lower equity prices. The US Dollar is boosted as consequence of the rise of the VIX, hence the greenback earned the sobriquet as safe haven. However, geopolitical risk may not necessarily be the broadest kind of risk that gets expressed by these two variables. We believe that “ expected inflation risk” is probably an even bigger factor which motivates these two measures of riskiness, especially the US Dollar. Inflation expectations have indeed become more significant since the implementation of the first QE. All else equal, when expected inflation risk is elevated, the USD TWI weakens, the yield curve becomes sharply steeper — pushing long bond yield higher in the process — and equity multiples become wider and prices decline. The converse is true: when expected inflation risk subsides, the US Dollar strengthens, the yield curve is flatter, equity multiples tighten, and prices rise. Indeed, the sharp rise in long-term inflation expectations basically steepened the long bond yield curve to historic highs during the early days of Quantitative Easing.
The recent sharp decline in the VIX therefore should have favorable impact on commodities, via the contemporaneous rise in equity prices, and forthcoming decline in the US Dollar, after a short lag. However, despite the high positive correlation between equity and commodity prices, the latter as an asset class offers significantly higher relative value. The stock market is indeed looking expensive especially compared with commodities.
 |
Main drivers this week
|
Commodities and Economic Highlights
Commentary by Robert Balan and Alessandro Gelli
Oil supply disruptions remain close to record levels
The price of Brent fell by more than $10 per barrel since the end of June. Most of the action occurred on the front maturities, contributing to bring Brent prices into a lasting contango for the first time since 2011. This was caused by declining concerns about oil supplies and weak refining activity in Europe. However, while the situation for European refiners has improved due to the rebound in margins, global supply disruptions has remained close to record level according to US government.
In its latest report, the EIA estimated global supply outages at 3.2 million b/d in July 2014, slightly down from May 2014 level (-200’000 b/d), which was a record high. Libyan crude oil supplies have recovered in July, leading to supply outages of 1.1 million b/d, down from 1.3 million b/d a week ago. Libyan crude oil exports have increased further these past few weeks as recently reopened ports are reducing their oil inventories due to the gradual restart of inland oil production. However, due to the deteriorating political situation, the Libyan oil supply outlook is highly unpredictable. Libyan crude oil exports are likely to be volatile in the coming months. Other countries are also experiencing elevated supply disruptions. South Sudan, Syria, Yemen, Iran, Nigeria and Iraq have all witnessed supply outages above 100’000 b/d since at least the beginning of the year.
These supply disruptions have therefore more than offset the rapid rise in US crude oil production. The US tight oil boom contributed to boost in US crude oil output by 1.1 million b/d per year in 2012 and in 2013 on average. This was the most rapid annual increase in crude oil production for a country in the oil market’s history. But despite this amazing rise in crude oil production, OPEC members with remaining idle producing capacity are forced to keep output at an elevated level to meet global demand growth. Combined crude oil production in Saudi Arabia, Kuwait and the UAE stood at 15.5 million b/d in July, leaving only 2.7 million b/d of spare producing capacity, a relatively low level. Between 2009 and 2011, OPEC effective spare capacity averaged 3.9 million b/d. Since then it averaged 2.6 million b/d. Spare producing capacity is likely to remain low in August, leaving the oil market vulnerable to supply disruptions.
The platinum-palladium spread could move down further
Palladium prices reached last week a 13-year high, driven by a combination of factors. Concerns about new sanctions against Russia added upside pressure on palladium prices as Russia is the world’s largest producer of palladium accounting of 40% of global output. There are also worries that Russia reduces palladium exports to Europe and the US in reaction to international sanctions. In May, when palladium prices were already above $800 per ounce, Gokhran, the state precious metals and gems repository in Russia, announced its intention to purchase palladium from domestic producers.
This is occurring, while the market is still recovering from the strike in South Africa. A five-month strike, which ended at the end of June 2014, greatly affected the production of platinum and palladium. The strike is estimated to have removed about 13% of global platinum supply and about 6% of global palladium supply. The impact on prices was at first limited due to the build up in commercial inventories in anticipation of the strike. Nonetheless, the strike is likely to bring the palladium market into a larger deficit than last year, as demand is growing at a faster level.
Improved car demand in the US and in China is indeed contributing to increase demand for palladium used in catalytic converter in gasoline-fired vehicles. Indeed, in July 2014, US new motor vehicle sales reached 1.44 million, up 9.1% y/y at a seasonally-adjusted annualized selling rate of 16.48 million, from 15.76 million vehicles in 2013. Strong vehicle sales since the beginning of the year are suggesting that vehicle sales could reach pre-recession levels this year.
Platinum has lagged palladium as the deficit is expected to be smaller than in the palladium market. According to Johnson Matthey, the consulting company, the deficit of the platinum market is expected to reach 14% of the global platinum demand this year, while in the palladium market, it could reach 15% of global demand. Demand for platinum is indeed under a more precarious situation as it depends from large diesel automobile markets such as Europe, which has recently showed signs of slower growth. The palladium market is on the other hand benefiting from stronger economic growth in the US and in China. Thus, palladium prices could outperform further not only platinum but also other precious metals.
Soft commodities’ leaders performance may ease
Soft commodities, such as coffee or cocoa, have been among the best performing commodities since the beginning of the year. They are up year-to-date (ytd) by respectively 55.0% for the ICE Arabica coffee, 20.7% for the LIFFE Robusta coffee and 17.1% for Cocoa. This is contrasting with the poor performance of cotton (-15.4% ytd) and sugar (-8.3% ytd).
The rally of coffee prices has been triggered by the drought conditions in Brazil, which affected the 2014 crop. The damages from the drought have been so important that the 2015 crop is also expected to suffer. The dry weather has already reduced by 30% the output from the nearly harvested 2014 crop in some regions, leading to an increase in coffee prices to a two-year high. The first signs of a weaker 2015 crop are already occurring as flowers are appearing a month earlier than usual in some areas. This is adding further upside pressure on coffee prices, especially as global coffee inventories may decline to the equivalent of 2.6 months of demand, the lowest since 2011. This is implying that the coffee market is in a vulnerable position. However, the large amount of net long speculative positions on coffee futures (both on the ICE and LIFFE contracts), which are close to record levels, is suggesting that the coffee market is approaching overbought conditions.
This is contrasting with cotton and sugar which are close to oversold conditions. We already made the case of a possible rebound in cotton prices driven by supply issues in Australia and India (See Diapason Commodities Insight Weekly as of August 11th, 2014). The case of sugar is not as good. The sugar market is under pressure due to the expected large crop in Brazil and in Asia. The reduction in the likelihood of the occurrence of El Niño also added downside pressure on sugar prices as dry weather in Asia triggered by El Niño would have had a major impact on global sugar supply. Nonetheless, demand for sugar continues to increase. Chinese sugar imports more than tripled in July from June level and reached the highest level since March. Rapidly growing oil consumption growth for transportation in Brazil is also leading to a stronger demand for sugarcane-based ethanol. Thus, despite improving crop conditions, stronger demand — also fuelled by current low prices — should lead to a stabilisation of sugar prices.
Cocoa prices upside potential may also ease as El Niño has a lower probability of occurring. Demand for cocoa may also slow down in Q3 due to lower grinder margins. Net long speculative positions are at an elevated level —albeit not at a record high level— implying limited upside potential. Thus, cocoa and Arabica coffee, which have been leading the soft commodity group, may lose their leading position in favour of lagging commodities such as cotton and sugar. These commodities could benefit from a technical rebound and slightly better short term fundamentals. However, this situation may not last. Cocoa and coffee could soon retake their position of leader in the soft commodities group.
Chart of the week: New correlations after the implementation of QEs
|
After the implementation of QE programs, the correlation between S&P and commodities (here using the equally weighted Continuous Commodities Index) turned positive, while both became negatively correlated with the US Dollar and the VIX. |
|
|
For the full version of the Diapason Capital Markets report, please contact info@diapason-cm.com