
August 11, 2014
The correction is over; Oil prices are now set to move significantly higher
Commentary by Alessandro Gelli, Energy Analyst
"These two developments – an Iraqi dam and cold showers in Kiev – introduce what the oil market dislikes most. It’s called uncertainty. Give it a week or so to percolate and see what happens to prices.”
Dr. Kent Moors, August 6, 2014
The volatility in the oil market has returned. The important correction, which started in mid-June, led to a $10 per barrel retracement in the price of Brent. This was triggered by reduced worries over oil supply — following the Libyan government announcement that crude oil exports would rebound sharply. However, while the supply/demand balance failed to ease significantly thereafter, it was the strength in the US dollar which fuelled the downside pressure on oil prices. With regards to the supply/demand balance alone, the oil price’s move has been excessive but was in fact necessary to clean up speculative positions. Net long speculative positions in oil futures had reached record levels by mid-June. The significant reduction in speculative positions, together with the likely decline in US dollar, and supportive fundamentals amid elevated geopolitical tensions, are pointing to a significant upward move in oil prices for the coming weeks.
The oil price’s correction contributed in reducing oil speculative positions significantly. On Brent, net long managed money positions reported by the CFTC, which had reached record levels in the last week of June, have fallen since then by 50% to the lowest level since early February 2014. This was not an isolated case, as net long speculative positions also greatly dwindled on other energy futures to lower levels. Total oil & gas net long speculative positions fell by 46% during the same period and have now reached the lowest level since mid-January 2014. This implies that energy prices have rapidly moved from overbought towards oversold conditions.
The US dollar, which rallied sharply in July, contributing to the recent decline of energy and agriculture prices, is now likely to weaken. Real rates are expected to fall further driven by stronger inflation expectations and declining rates. This should add downside pressure on the US dollar and contribute to higher oil prices as in the period between mid-2010 and mid-2011 when falling real rates led to a significantly weaker US dollar, which in turn, contributed — with the decline in real rates — to the rise in the price of Brent from around $75 to above $110 per barrel. The acceleration of economic growth in emerging countries, will likely continue to be faster than that in the US, already reflected into lower FDI in the US and should thereby contribute to a weaker US dollar. Again, that would also be positive for oil prices. Thus, after having been a dead weight, the US dollar could become an important supportive factor for an upside move in energy prices, and for agriculture prices.
This is occurring while the oil market continues to benefit from strong fundamentals (See Diapason Commodities Insight Weekly, “Tighter supply/demand, low inventories and high supply risks; the recipe for a significant rise in oil prices”, July 14, 2014). In August, the oil market is also likely to be supported by improved refining margins in Europe and maintenance work in the North Sea (see below Commodities and Economic Highlights, “The rebound in European diesel crack spread could boost refining activity”). On top of that, the oil market has, in these past few weeks, underpriced rising geopolitical tensions in the Middle East and in Eastern Europe. Oil supply disruptions are now at an elevated level while petroleum inventories, on the other hand, are small relative to the previous years. Furthermore, Saudi Arabia’s spare producing capacity is also at a low level (see last week's Commodities and Economic Highlights, “Geopolitical risks are underestimated by the market”, August 4, 2014).
Oil prices are therefore in a zone where the downside is clearly limited with regards to speculative positions and supply disruptions. On the other hand, upside potential is becoming more and more well-defined due to tighter fundamentals, a potentially weaker US dollar, and underpriced geopolitical risks. Front-month Brent contracts , which moved into contango in July, are likely to move back into backwardation. Brent prices are likely to climb above $110 per barrel and then retest last year’s high at $117.
 |
Main drivers this week
|
Commodities and Economic Highlights
Commentary by Robert Balan and Alessandro Gelli
The rebound in European diesel crack spread could boost refining activity
European refiners suffered greatly from low margins between May and July 2014. By the beginning of June, the European ultra-low sulphur diesel crack spread has indeed fallen below $11 to the lowest since mid-2010. This was due to weak domestic demand, while Russian diesel flooded the European market and new refineries in the Middle East won market shares in Asia, leaving Europe with an important surplus. Moreover, the tight oil boom in the US, which contributed to record US high refining activity — contrasting greatly with Europe — has reduced the need for the US to import European gasoline. It also contributed to greatly increase US petroleum exports to Africa, thereby grabbing market share from European refiners.
However, European diesel crack spreads have increased and are now back to April 2014’s level, slightly above the past 18 months average. This could encourage European refiners to increase activity. Stronger crude demand may have an important impact on the crude market as supply could fall in August. Crude oil production from North Sea fields is indeed expected to decline due to seasonal maintenance work. According to preliminary estimates, North Sea crude loading should fall to 1.7 million b/d, down 3.4% m/m. Moreover, Russian crude oil exports have fallen to 4.3 million b/d in July 2014, down by 500’000 b/d from April 2014 level. They are likely to remain at a low level in August due to high refining activity in Russia. Furthermore, hopes to see a strong rebound in Libyan crude oil exports could soon fade as the rapidly deteriorating political situation is preventing this possibility to happen.
Despite mild economic growth, low distillate petroleum inventories in Europe would require rebuilding inventories especially before winter, when demand typically increases. According to the International Energy Agency, European OECD middle distillate inventories stood at 246.6 million barrels at the end of May 2014, down by 10% from the 5-year average. This should support diesel crack spread. Higher refining activity in Europe encouraged by more elevated diesel crack spread amid tighter crude oil supply could boost demand for West African crude oil, which is of similar quality than Brent (light and sweet) and has suffered in July due to weak European and Asian demand. European refiners may also be competing with Asian refiners for West African crude oil as Asian refining activity is likely to accelerate in August and could reach 26.6 million b/d, up from 1.3 million b/d from May 2014 level and up by 300’000 b/d m/m (+600’000 b/d y/y). This should contribute to add further upside pressure on Brent prices.
Growing geopolitical tensions pushing prices of Russian commodities higher
Geopolitical tensions surrounding Ukraine have recently increased, adding upside pressure on prices of commodities produced and exported by Russia. Europe and the US have implemented new sanctions against Russia following its involvement in Ukraine. Russia has responded by imposing a counter ban on some food imports from the US and Europe. Concerns are now arising on possible new sanctions from Europe, the US or Russia, which could affect key Russian commodities.
Russia is a major commodity producer and exporter. It belongs to the top 5 exporters or producer group in nickel, aluminium, gold, silver, platinum, palladium, wheat, corn, crude oil and natural gas markets. Sanctions that could harm the trade or the output of any of these commodities could therefore have a major impact on commodity prices. Recent developments have therefore contributed to the outperformance of most of these commodities within their respective sector. In the base metals sector, nickel and aluminium prices outperformed other base metals last week as Russia announced a ban on some agricultural products from some Western countries. Russia is the world’s second largest producer of refined nickel and primary aluminium, with output reaching respectively 270’000 metric tonnes and 3.7 million metric tonnes in 2013. It is also the world’s largest exporter of aluminium and aluminium alloy, accounting for 26% of global trade last year. Within the precious metals sector, Russia is also the world's biggest exporter of palladium and its second-largest platinum exporter after South Africa. Russian gold production accounted for 7.5% of global production in 2013, allowing the country to be amongst the world’s top 5 gold producing countries. In the energy sector, Russia produced 10.8 million b/d in 2013, slightly behind Saudi Arabia, the world’s largest oil producer. Russia is also the largest exporter of natural gas. Within the agriculture industry, Russian wheat and corn exports accounted for respectively 11.3% and 3.2% of global trade in 2013.
Sanctions against Russian banks could affect credit required for operational activity of Russian-based commodities companies. Moreover, commodity producing companies, often linked to the government, could be directly targeted by new sanctions, which could have major impact on commodity markets. Top Russian commodity producing companies are among the world’s largest: Polyus Gold — the world’s eighth largest gold producer; Norilsk Nickel — the world’s largest producer of nickel and palladium and among the top 5 largest producer of platinum; UC Rusal — the world’s largest aluminium company; Rosneft — the world’s largest publicly traded petroleum company; and Gazprom — the world’s largest natural gas producer. Increasing tensions between western countries and Russia are therefore likely to push the geopolitical risk premium on these commodities higher, allowing them to continue to outperform their respective sector. The forward curve in some markets has already priced in the potential negative impact of the sanctions on future commodity production. Helped also by the situation in Iraq, the Brent’s forward curve has flattened significantly these past 2 months.
Oversold cotton prices could rebound driven by Australia and India
Cotton prices have been the worst performer in the agriculture sector this year, declining by almost 20% year-to-date. This caused a significant reduction in speculative positions. Net long speculative positions dwindled to the lowest level since November 2013. Short speculative positions especially increased and reached the highest level since November 2012 — an elevated level compared with the previous 7 years — implying that cotton prices moved towards oversold conditions.
The decline in prices and increasing negative sentiment on the cotton market were caused by expectations of a major increase in US crop production. According to the USDA, the US cotton crop may increase by about 27% to 16.5 million US bales (of 480 pounds) in the 2014-2015 season amid weak domestic and foreign demand. This should contribute to an increase in US cotton inventories to 5.2 million US bales (+2.5 million US bales y/y) — the highest level since the 2008-2009 season — and could contribute to about half of the expected rise in global cotton inventories to 105.7 million US bales (+5.2 million US bales y/y), a new record high level.
However, US exports forecasted by the USDA may have underestimated foreign demand, which in turn implies that US cotton inventories are not likely to increase this much. Indeed, other major cotton producers could see an important reduction in output, which could lead to higher purchases of US cotton. The Australian cotton crop is currently suffering from a drought, which could lead to a 40-50% decline in production for the 2014-15 season. Drought conditions may bring the Australian cotton production to 2.7 million US bales, down from 4.1 million US bales this year. This could have a major impact on the global cotton market as Australia is the world’s third largest cotton exporter. This would be the second year in a row that Australian cotton exports would be declining due to dry weather.
Moreover, this is likely to occur while the Indian cotton crop is at risk of a significant decline. India was also hit by drier than usual weather in June, negatively affecting the crop conditions. The monsoon has indeed been far weaker than usual in India — the world’s second largest cotton producer and exporter. This has delayed sowing, increasing concerns about output. This could lead to a larger decline than the one expected by the USDA (-2.5 million US bales y/y).
However, the situation in China, the world’s largest cotton producer and consumer, is mixed. On one hand, the end of direct purchases for state inventories should contribute to a decline in cotton output by 24% to around 23.3 million US bales according to a state-affiliated researcher. The old system would be replaced with a trial program of direct subsidies to farmers but only in the Xinjiang state, which accounts for half of China’s cotton production. The new measure has contributed to reduce Chinese cotton planting by 12.5% y/y to 4.2 million hectares. But this may not translate into higher Chinese imports as the government has recently released cotton from its large inventories. Chinese cotton inventories reached 61.3 million bales during the 2013-2014 season, accounting for 59% of global cotton inventories. In fact, the situation in China is not as bad as it could appear despite high inventories. Indeed, the significant Chinese cotton inventories hung over the head of market participants. The fact that the inventories are being released, while domestic output is expected to decline quite sharply, is likely to have a lower impact on international cotton prices that it would have otherwise. Consequently, this may not prevent a rebound in cotton prices driven by tighter conditions in Australia and in India and oversold conditions.
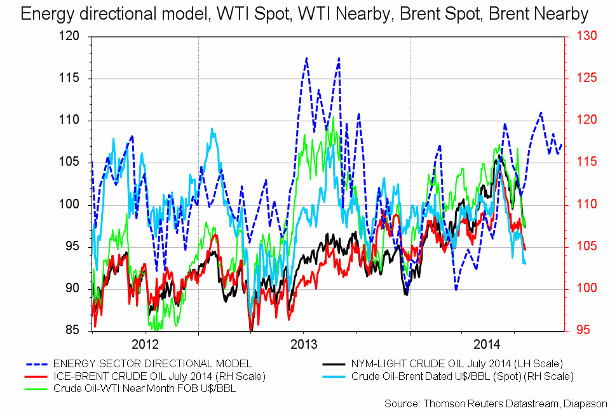
Chart of the week: Oil prices are set to recover
|
Our energy model had correctly warned us about the correction in oil prices. However, the latter was still more substantial than expected. In turn, lower oil prices than initially expected and more supportive fundamentals ahead should lead to an important recovery in oil prices, as suggested by our model. |
|
|
For the full version of the Diapason Capital Markets report, please contact info@diapason-cm.com