
July 7, 2014
A brighter second half of the year: Get aboard the growth train
Commentary by Robert Balan, Senior Market Strategist
"The global economy ended the second quarter on a high note. Growth rates for output and new orders accelerated to the fastest since February 2011, according to PMI™ survey data. The upturn also broadened out, with growth spurts in the US and the UK being accompanied by signs that Asia is lifting from its recent soft patch.”
Markit Economic Research, July 3rd, 2014
The first half of the year ended with a very positive note for commodities. The DCI® Total Return rose by 6.0% in the first semester, slightly below the S&P (+6.1%). Within the commodity sectors, precious metals outperformed, with the DCI® Precious Metals Index rise of 9.7%, followed by the DCI® Agriculture Index (+8.6%). On the other hand, the DCI® Base Metals and Energy Index lagged the sector, with respectively +2.5% and 4.8%. Slower than expected global growth in Q1 2014 contributed to the outperformance of the defensive commodities over the cyclicals. But we believe this may change in the second half of the year, as growth takes hold, favoring the cyclical sectors.
We expect to see firmer US growth in Q3 or in Q4, but the lost growth in Q1 is unlikely to be completely re-captured over the rest of 2014. In our view, the US second half growth could be significantly stronger than in H1, but annual GDP growth for calendar year 2014 could be below 2.5%, lower than we expected earlier in the year. Nonetheless, as counter-point to the downgraded expectations, we expect an acceleration of global growth in H2, on the back of a continuing euro area recovery, upgraded China growth, stabilizing activity in Japan, in addition to the aforementioned rebound in US growth. China in H2 may exceed the 7.5% annual GDP growth which Premier Li Keqiang referred to as "baseline", Japan may also post an annual 1.7% real GDP growth in Q4, while Europe could end Q4 with a 0.5%-0.6% real GDP growth.
We still believe that the q-o-q output for the primary economies will peak in a sequence — the US in Q3 or Q4 2014 (3.4% - 3.6%), the eurozone in Q4 (0.5% - 0.6%) and China in Q1 2015 (7.7% - 8.0%). Global GDP may end 2014 at 4.1% - 4.3%, the strongest growth since the end of the global recession in 2009. The key driver will be manufacturing — forward-looking new orders suggest growth until year-end. Base metals are likely to especially benefit from this environment as well as other cyclical commodities such as energy and the most cyclical agriculture commodities such as lumber or the other "soft" commodities. This could also fuel global equities, until at least Q4 2014. But the equity market’s upside potential may be less than what we can expect from commodities under those conditions.
One of the spillovers of higher growth and the likely upward move in commodity prices is the acceleration of inflation. The latter started to rise significantly in H1 2014 in the US and will likely accelerate further in the second half. We believe that the Fed will be unable to dismiss the rise in inflation as ‘noise’ in upcoming meetings — US inflation will increase more rapidly than the Fed forecasts, in our view. This may lead the Fed into a "policy mistake" going into the year end: the FOMC may start musing about policy tightening, even as the economic growth remains below trend. This, we believe, will contribute to a much slower, even negative US growth, during the first half of 2015. Moreover, we expect the 10yr yield to fall further this quarter before pulling back by late Q3-early Q4. The decline in rates could occur amid rising inflation, leading to a significant decline in real rates. This should be another positive factor for commodities (See Commodities Insight Weekly “Commodities should soon benefit from lower real rates”, May 26th 2014).
The third key theme which may make a difference in the second half of the year is the likely decline in the US Dollar. We made the case last week, citing several factors which could weaken the currency, e.g., falling real rates, weakening of the CNY, etc (See Commodities Insight Weekly “The USD faces a perfect storm”, June 30th 2014). The agriculture and the energy sector could be the main beneficiaries of the lower USD, amid ongoing supply risks. Investors will have to keep indeed a wary eye on geopolitics and on the possible occurrence of El Nino. However, Gold and Silver may significantly lag behind the major commodity sectors. Moreover, despite the rise in prices in the first half of the year, commodity prices remain cheap relative to equities and especially against the US equity markets.
 |
Main drivers this week
|
Commodities and Economic Highlights
Commentary by Robert Balan and Alessandro Gelli
China is back and so are the base metals
Last week, base metals prices moved sharply higher driven by stronger than forecasted Chinese economic data. In June, the NBS Manufacturing PMI rose to 51.0, while the HSBC Markit Manufacturing PMI reached 50.7, the highest level since November 2013. This confirms our long-hold conviction that the Chinese economy will rebound in Q2 2014. China's recovery positively impacts base metals the most, as can be seen from the rise of the DCI® Base Metals by 3.1% during last week. This was the best performance within the commodity complex — it was also better than S&P 500's +1.2% and the MSCI Emerging Markets' +1.6%.
The improved economic activity in China is the result of the gradual implementation of pro-growth policies. On the monetary side, the Chinese leadership has conducted its stimulus strategy on two fronts. First, it targeted a weaker currency in order to stimulate the export industry. The CNY/USD fell by around 2.8% between its January’s high and last week. This was the largest depreciation of the Yuan against the US Dollar in such a short period since the early 1990s before the Yuan was pegged to the US Dollar. Second, the Chinese government selectively loosened banking restrictions. Its last measure was implemented last week as it increased banks’ capacity to lend money. This followed last month’s reduction in the banks’ reserves requirement at the central bank for banks heavily exposed to the farming sector and small-and-medium sized firms. At the same time the Chinese government took steps to cool down rampant speculation on real estate. This “targeted stimulus” contrasts sharply with the “broad stimulus” implemented in 2009. Moreover, on the fiscal side, the Chinese government announced in early April 2014 a spending package for new railways and subways, low-income housing and tax breaks for small businesses. This, combined with the looser monetary measures contributed to the rebound in Chinese economic activity, precluding a hard landing feared by many.
The improved sentiment on China was reflected in the good performance of base metals prices, which remain well below their previous peak. For example, LME Copper prices rose by about 10% since mid-March 2014, but are still down by almost 30% from their early 2011 high. As illustrated in this week’s main commentary, we expect an acceleration of the Chinese economic activity in the second half of the year, which could extend to the first quarter of next year. In this environment, the base metals sector is likely to continue to perform well, contrasting with last year's performance when the DCI® Base Metals Index fell by 12.5% during the year. Several metals, which had lagged the sector, such as copper, aluminium and lead could soon outperform. These metals should benefit from stronger demand and from a tighter than expected supply.
Libyan crude oil production may not rebound as quickly as anticipated
The announcement that Libyan crude oil exports would restart should be taken very carefully and especially by Saudi Arabia. The latter should in theory reduce its crude oil production if Libyan crude oil production takes off. However, as we enter the two most critical months for the oil market, the kingdom may not be willing to bet on the supposed restart of Libyan crude oil exports. The Libyan government has announced several times already that production would restart soon, while it didn’t materialise, or only lasted a very short period, keeping Libyan crude oil out of the market.
According to Energy Intelligence Group, Libyan crude oil production fell from 1.5 million b/d in April 2013 to 1.2 million b/d in July 2013, due to protests at oil ports. Then, eastern autonomist groups halted operations at four oil terminals as they asked for more autonomy for the Cyrenaica region amid strikes and ongoing protests in the western region, leading to the decline of Libyan crude oil production to 0.2 million b/d in September 2013. This had an important impact on the oil market as the Libyan crude oil is light and sweet close to the Brent crude oil quality and is hence very appreciated by European refiners. The size of the supply disruptions is also significant as Libyan crude oil capacity (at around 1.5 million b/d) accounts for about 10% of Europe’s refining capacity.
Moreover, even if the Libyan government managed to avoid strikes and opposition from various political groups, it will take several weeks to restart oilfields to their maximum capacity. Furthermore, some reports suggested that the repeated attempts to restart production may have damaged the oil reservoirs, reducing Libyan crude oil production capacity. In any case, a rapid rebound in Libyan crude oil production is possible but highly unlikely. The global oil market would still need additional Saudi crude oil barrels for the summer.
Flight to quality is exaggerated on the wheat market
Wheat prices have been resilient following the last USDA report, which had an especially negative impact on corn and soybeans prices, as the wheat market has tighter supply/demand fundamentals. The wheat futures price in Chicago fell by only 0.9% during the week, compared with a decline of 8.8% for soybeans and of 6.7% for corn. Contrasting with US corn and US soybeans, which are both expected to have a significant crop this year, the US wheat crop is expected to be in line with the historical average. Strong demand should even lead to lower US wheat inventories. The USDA expects US wheat inventories to fall by 17.4% during the 2013/14 season and by 3.2% during the 2014/15 season, bringing inventories to the lowest level since the 2007/08 season.
Nonetheless, the price performance within the wheat complex has been quite different. Indeed, the price of the Kansas Wheat future has outperformed other types of wheat. This is a hard red winter wheat, which is the most abundant crop in the US and has a higher protein content than the most popular wheat future traded at Chicago. The Chicago Wheat, a soft red winter wheat, is grown in a different area (the South, The Great Lakes region and east to the Atlantic) than the Kansas Wheat (Nebraska, Kansas, Oklahoma and Texas). They are both winter wheat (planted in mid-August through the end of October). The smaller protein content of the Chicago Wheat makes it more vulnerable to a decline in quality as wheat of low quality (protein content falling below 10%) is unsuitable for bread making. The wheat of lower quality is typically sold to produce flour of lower quality (e.g. for biscuits and cakes) or as animal feed and hence has a lower commercial value.
Heavy rains that have recently hit parts of the US Midwest have threatened the quality of the Chicago wheat leading to the outperformance of the Kansas wheat. However, the premium of the Kansas Wheat over Chicago Wheat has reached levels close to the highs of May 2011 when a major drought hit the US. The current situation cannot be compared with 2011. The spread has reached unsustainable levels. Following the release of the USDA report last week, the Chicago wheat already started to outperform the Kansas Wheat. This should continue in the coming weeks.
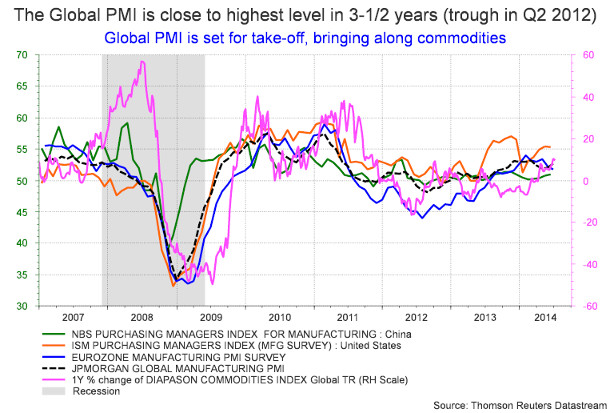
Chart of the week: Global growth is set to take-off, bringing along commodities
|
Global growth is about to accelerate and could reach the strongest level since the start of the global recession of 2009. In June, manufacturing PMI from the US, China, Japan and Europe are pointing to higher growth. This would be the first time since 2010 that these countries are seeing a more rapid economic activity coincidentally. This should be positive for demand of cyclical commodities such as base metals and energy. Growth remains a key factor for those sectors. |
|
|
For the full version of the Diapason Capital Markets report, please contact info@diapason-cm.com