
May 19, 2014
Supply fails to keep up with global oil demand growth amid tight inventories
Commentary by Alessandro Gelli, Energy Analyst
"While OPEC production gains of around 400,000 barrels per day went some ways towards easing markets last month, that gain will be insufficient to meet market needs in the second half of the year, when consumption bounces back seasonally.”
International Energy Agency, Oil Market Report, May 2014
The fundamentals of the oil market have gradually tightened and are likely to tighten even further, hinting to higher oil prices during the summer. Global oil demand is indeed growing at a more rapid pace, while oil supply is not expanding as rapidly and inventories are at a low level. According to the US Energy Information Administration (EIA), OECD oil demand grew by 190’000 b/d y/y on average during the first four months of this year, compared with flat growth during the same period last year and a decline of 565’000 b/d y/y on average between January and April 2012, reflecting the improved economic conditions in OECD countries, which is likely to continue. According to the OECD Secretariat, GDP growth of OECD countries is expected to accelerate to 2.2% in 2014 and to 2.8% in 2015, driven by the United States, which growth is projected to reach 2.6% in 2014 and 3.5% in 2015. Oil demand growth from these countries is hence likely to remain positive throughout the year.
In non-OECD countries, oil demand grew by 1.1 million b/d y/y on average between January and April 2014, an improvement from the second half of last year when it grew by only 670’000 b/d y/y on average. Non-OECD oil demand growth is expected to remain strong, driven by the rebound in the Chinese economic activity, which will more than offset slower economic growth in Russia. It is the first time since 2010 that both non-OECD and OECD oil demand are growing together. Last week, the International Energy Agency has revised higher its forecast of global oil demand growth for this year by 65’000 b/d to +1.3 million b/d, the strongest growth since 2010.
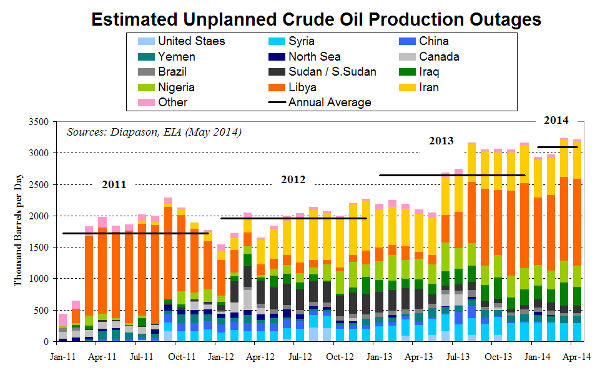
On the supply side, the situation is not as clear. On one hand, crude oil supply is growing at a rapid rate in the United States. But the surplus of light sweet crude oil, not adapted to US refineries which continue to import heavy crude oil, cannot be exported due to regulatory ban. On the other hand, oil supplies in the rest of the world are subject to disruptions and delays at new projects. According to the EIA, global supply disruptions have averaged more than 3.0 million b/d since the beginning of the year (see below chart) due to the unstable political situation in Libya, Iraq and Yemen, the civil war in Syria and in South Sudan, international sanctions against Iran, oil theft in Nigeria and renewed attacks against the oil infrastructure in Colombia. These disruptions are occurring amid rising social unrest in Venezuela, delays at a major oilfield in Kazakhstan and persisting decline at mature oil fields in Mexico, Indonesia and the North Sea. On top of growing worries in Eastern Europe, geopolitical concerns on Iran could also come back this summer as an agreement over the Iranian nuclear program would be extremely difficult to achieve.
The tighter global oil supply/demand balance is occurring while global petroleum inventories are at a low level. Indeed, according to the International Energy Agency, OECD commercial inventories fell to 2.57 billion barrels in March 2014, the lowest level since 2008 for this time of the year. The deficit to the 5-year average stood at more than 110 million barrels, compared with a deficit to the 5-year average of only 26 million barrels in H1 2013, and 61 million barrels in H2 2013, implying that the oil market has gradually tightened since last year.
Furthermore, the barrels of last resort, typically provided by Saudi Arabia, might be difficult to find this summer when Saudi domestic oil demand from the power sector could rise towards 1.0-1.2 million b/d, up from 700’000 b/d in February 2014. This would force the Kingdom to increase production during the summer above 10.0 million b/d to meet rising domestic and foreign demand, thus reducing its spare producing capacity, which is the oil market’s ability to respond to a supply shock. Therefore, without sufficient supply to respond to the demand’s acceleration, oil prices need to rise in order to see a rationalisation of oil demand. These concerns already triggered a rise in the ICE Brent’s backwardation, which reached for maturities up to April 2015, the highest level since September last year. The annual expected roll yield of the ICE Brent reached 5.7% at the end of last week, the highest level since March 2014, above the average of 3.9% between 2011 and 2013.
 |
Main drivers this week
|
Commodities and Economic Highlights
Commentary by Robert Balan, Alessandro Gelli and Marion Megel
US natural gas demand from the power sector to increase by year-end
New regulations are expected to affect the US natural gas market. Indeed, new regulations on emissions from power plants are likely to force utilities to close the least efficient coal-fired units. This is likely to lead to a net loss of coal-fired generating capacity of 4’938 megawatts in 2014 and of 11’993 megawatts in 2015. The latter is extremely important as it is expected to more than offset the additions of generating capacity such as natural gas (+6’427 megawatts in 2014 and +6’667 megawatts in 2015). The expected decline in 2015 of US generating capacity would be the first since 1998, when generating capacity fell for the first time since at least 1950 when data started.
Natural gas-fired generators are expected to account for the bulk of net generating capacity additions in the coming years. This is likely to push further up the market share of natural gas in the US power market, which has already increased substantially. Indeed, between 1999 and 2013, the share of natural gas used in power generation increased from 15% to 27%, while coal use’s dwindled from 51% to 39% during the same period. This is contrasting with last year when the share of coal in power generation increased at the expense of natural gas due to low coal prices relative to natural gas.
This rise in demand is likely to be felt by the gas market at the end of this year and especially during the summer 2015, when power plants would be running near capacity to meet seasonally strong demand. On the other hand, US natural gas demand could be negatively affected this summer by the occurrence of El Niño which would contribute to a wetter than usual summer and mild temperatures, reducing the use of air-conditioning, while at the same time boosting hydroelectric generation.
The physical copper market remains tight despite the global surplus
The copper price has improved over the past two weeks but is yet to fully recover from its March 2014 collapse (following China’s first bond default in recent history). The red metal’s price is being constrained by three major elements: 1) worries regarding China’s demand; 2) fears that financing deals would stop and cause a massive release of Chinese inventories in the spot market; and 3) increasing supply that is pushing the global market into surplus.
However, the current physical market appears still tight, suggesting that the above first two fears are overdone. Indeed, the physical market would not be tight if China’s demand was not holding firm and/or if inventories were massively released onto the market.
Evidence suggesting a tight physical market is plentiful. Firstly, the copper forward curve is still in backwardation, despite the global surplus expected for this year and next. Secondly, consumers’ premiums remain high globally and especially in China where they reached twice the levels seen in 2012 and early 2013.
Furthermore, China’s imports have remained remarkably strong in April, at 450,000 tonnes, up 52% from April 2013. This figure was particularly strong given the wide consensus that imports would slowdown following Chaori Solar’s default. Indeed, financing trades are said to have lessened in the past weeks and the depreciation of the Yuan has made the SHFE-LME arbitrage unfavourable to imports. Despite all this, imports are on the rise and inventories too. The restocking cycle continues and the SRB is said to have accelerated its purchase of copper. The current prices are seen as buying opportunities by the Chinese.
The tightness in the physical market and China’s purchases suggest that demand is holding firm.
Gold investment demand flew from West to East last year
GFMS released its gold report and confirmed that demand flew from west to east last year. Unsurprisingly, the statistics provider outlined the western investors’ lack of interest for the yellow metal in 2013: gold ETFs’ holdings peaked at 2,698 tonnes at the start of 2013 and fell by 880 tonnes over the year. Also, inventories on the major gold exchanges fell by a total of 99 tonnes.
However, these outflows turned into inflows in Asia and the Middle East. The trade flow came in Switzerland, where refineries were running at full speed to meet Asian demand for jewellery. Furthermore, Asian bar demand also surged, meaning that investment demand remained high on a global basis last year despite the western world’s disinvestments. China’s bar demand surged by 44% and India’s by 29% despite the myriad of obstacles the government introduced to limit gold demand. Demand was not limited to the two largest gold consumers as many other Asian countries showed strong appetite, such as Thailand (up 55%).
Demand from Asia should continue to accelerate this year, especially since prospects for India’s demand is improving. Imports rebounded in March, following six months of very low import levels. The country’s official gold imports are estimated at around 50 tonnes, the highest level since Q2 2013 and compared with only 10 tonnes imported officially in September last year. Furthermore, sales of gold jewellery have increased. According to Societe Generale (Precious Metals Drivers, April 17 2014), the average daily sales are currently 8 to 10% higher than the average seen in the first quarter of this year. The newly elected government led by Narendra Modi is expected to be more gold-friendly. Although there is no guarantee as to whether the government will ease import restrictions and duties, it will probably look at restraining black market activities, which are likely to have soared in the past months. This could support India’s gold demand in the coming months.
The sugar market could move back into deficit
Following Coffee and Cocoa, Sugar could become the next Soft commodity to move back into deficit. The sugar market is now expected to move into deficit next season due to lower sugar cane crop in Brazil, the world’s largest producer of sugar. This would follow a strong sugarcane’s crop last year in this country. The move into a deficit has taken some market participants by surprise due to the record amounts of replanted cane in Brazil. By replanting cane instead of suing old cane plants, farmers are reducing the risk of disease and the vulnerability to extreme weather. However, despite these favourable factors, the dry weather that hit the southern part of Brazil, where most of Brazil sugarcane plantations are concentrated, has negatively affected the sugarcane crop.
According to Copersucar SA, the world’s largest sugar trader, the deficit in the sugar market could reach 2-3 million tonnes for the 2014/2015 season starting on October 1, ending four years of surplus. The trading company is not alone. Last week, Datagro, the leading Brazilian sugar consultancy, also revised higher its forecast of the sugar deficit for the 2014/2015 crop year to 2.5 million tonnes, up from previously 1.6 million tonnes, while it reduced its estimation of the 2013/2014 world sugar surplus to 2.2 million tonnes from 2.3 million tonnes.
Moreover, there is a risk that the deficit could widen further, as the occurrence of El Niño this summer could lead to drought conditions in southern Asia, negatively affecting the sugarcane crop in India and Thailand. This weather phenomenon could lead to excess rain in Brazil, which could have a negative impact on the harvest, increasing the deficit and hence adding further upside pressure on sugar prices.
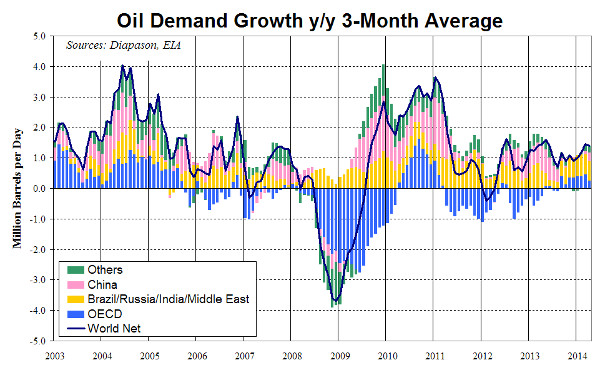
Charts of the week: Global oil demand growing amid elevated supply disruptions
|
Global oil demand is growing at a more rapid pace, driven by stronger demand in both non-OECD and OECD countries. Oil demand growth in the latter is a major change compared with the previous four years, when it fell significantly, mitigating strong growth in non-OECD countries. The latter also experienced slower growth last year, driven by weak demand from China. However, latest data are indicating that global oil demand is now growing at a synchronised pace for the first time since 2010. This is occurring while supply disruptions are above 3.0 million b/d, an elevated level compared with the previous years. Indeed, between 2011 and 2012, supply disruptions averaged slightly less than 2.0 million b/d. It is only in the summer of 2013 that supply disruptions rose towards 3.0 million b/d as crude oil production dwindled in Libya due to protests while international sanctions forced Iran to reduce its crude oil output. Current elevated supply disruptions and stronger demand have triggered a more important than usual drawdown in petroleum inventories, leaving the oil market in a more vulnerable situation ahead of a tighter market during the summer. |
|
|
For the full version of the Diapason Capital Markets report, please contact info@diapason-cm.com