
May 12, 2014
Commodity structure: Let’s talk about backwardation
Commentary by Robert Balan, Senior Market Strategist, Alessandro Gelli, Energy Analyst, Marion Megel, Metals Analyst
"Economically, the convenience yield can be interpreted as the monetary value of benefits achieved from holding a commodity in its physical form. Thus, at times when the magnitude of the convenience yield exceeds the total cost of holding the physical commodity, markets will go into backwardation, as inventory holders estimated a higher value for their asset. The convenience yield is assumed to be closely linked to storage levels and peoples fear of stock- outs, indicating that the convenience yield is large in periods of scarcity, and close to or equal to zero in times with surplus.”
Vegar Nordvold, “An Empirical Study of Backwardation in Commodity Markets (1990-2012), based on the Theory of Storage and the Convenience Yield”, September 2013
As Q2 2014 begins, one of the more exciting developments in the commodities space since 2006 was the observation that futures curves for a host of commodities are moving into backwardation. The normal state of the commodity term structure is a contango — a situation where the futures price of a commodity is higher than the expected spot price. In a contango situation hedgers or arbitrageurs and speculators, are "willing to pay more for a commodity at some point in the future than the actual expected price of the commodity..." (Investopedia). Backwardation is the inverse of that process. Backwardation is technically defined as a "positive basis", a condition that arises when the current spot prices rises to become higher than the contract prices further in the forward curve. The operative link is the "convenience yield" — a notion of a benefit when expectations is of relatively high scarcity of the commodity today vs some time in the future.
The backwardation phenomenon has actually been building up in the commodity space during the past four years, but at low thresholds until earlier in the year when the Diapason Commodities Index® (DCI) components broke through the 35% level. The big surge came in early Q4 2013, which preceded the big rally in agriculture that commenced in January — the DCI® percentage of commodities going into backwardation was more than 50% at some point in March 2014. The percentage of commodities in backwardation in the DCI® has recently fallen to 40%. Nonetheless, when considering the index’s weights, 66% of the DCI® was in backwardation in early May 2014. The DCI® is a good representation of the commodity markets as it includes 50 commodities, significantly more other commodity indices such as the Dow Jones-UBS Commodity IndexSM (DJ-UBSCISM) which only includes 20 commodities.
Moreover, backwardation also widened and reached elevated levels for several commodities. The backwardation on Brent futures, which started as early as 2011, recently widened due to higher concerns on oil supplies while inventories at a low level and demand is growing at a faster pace (see below: Brent backwardation’s rise supported by supply risks). On the agriculture market, severe drought conditions in the US have contributed to soaring front month’s prices of several grains futures, leading to a significantly wider backwardation. In the soybean market, the backwardation between the May 2014 and November 2014 contracts stood around 20% since the end of February, an extremely elevated level due to the expected strong new-crop soybean (US soybean is typically been harvested in October and November), while US soybean inventories are at a low levels amid rapidly rising global demand growth, which is expected to increase by 4% y/y.
Some commodities are showing significant roll yields. The annual roll yield of the NYBOT Cotton and the CBOT Soybean Meal currently stands at around 10% and 20% respectively. Other agricultural products such as corn, European wheat and lean hogs have recently moved into backwardation, due to the persisting worries on supplies. In the metal sector, only LME Copper and LME Tin are in backwardation. On the other hand, the NYBOT Coffee and the LME Nickel, which have been since the beginning of the year the two best performers within the commodity sector (up respectively by 62% and 43% YTD) are in contango. Between January and April 2014, the roll yield on the DCI® reached 1.6%, while on the DJ-UBSCISM it stood at 0.1%.
In this environment, commodity prices tend to perform well (see chart of the week). Backwardation is indeed signalling that supply fails to meet demand growth. This price structure also discourages holding of inventories. The backwardation on the oil market indeed resulted in the important decline in OECD oil inventories these past few months. In February 2014, they reached 2.6 billion barrels, the lowest level since 2005. Moreover, backwardation offers a positive roll yields for commodity indices. Hence these are especially favourable time for investors willing to increase their exposure to commodities to benefit from both the price appreciation and the roll yield.
 |
Main drivers this week
|
Commodities and Economic Highlights
Commentary by Robert Balan, Alessandro Gelli and Marion Megel
Canadian producers must use rail instead of pipelines
The US government has recently decided to postpone the final decision on the Keystone XL pipeline project, which would bring heavy Canadian oil to the US. The project has become highly politicized as US environmental groups oppose the use of bituminous crude oil from Canada, which is considered to have a larger environmental footprint.
Nonetheless, opposing the pipeline doesn’t mean that the bituminous crude oil is blocked at the border. Indeed, the lack of pipeline capacity has forced Canadian producers to ship crude oil to the US using rail, which is in fact significantly less safe for the environment due to the higher amount of incidents (causing oil spills) than pipelines. According to the International Energy Association, the risk of a train oil spill was six times greater than that of a pipeline incident between 2004 and 2012.
The important rise in the number of oil spills from rail could lead to more stringent safety regulations, which could increase the cost of rail transportation. In turn, this is likely to have a negative impact on Canadian producers as they rely growingly on rail to move the oil out of Canada, due to the lack of new pipeline capacity.
The final decision about the Keystone XL pipeline project could be taken after the US mid-term elections at the beginning of November, implying that the pipeline will not be operational before mid-2016. Moreover, other Canadian pipeline projects are facing setbacks. The start of Enbridge’s Northern Gateway pipeline, which is expected to link Alberta to Kitimat, on the Western Canadian coast by 2018, could be delayed as last month residents from Kitimat voted against the project.
Moreover, aboriginal groups in British Columbia are also opposing the project. Delayed pipeline projects imply that Canadian producers will have to use rail, which is about 3 times more expensive than pipeline for crude transportation, hence implying that Canadian prices will keep an important discount relative to US prices. Rail nonetheless, allowed the WTI-Western Canadian Select (a medium crude oil price benchmark in Alberta) to fall recently towards $20, down from about $40 in November 2013.
Brent backwardation’s rise supported by supply risks
The backwardation on the ICE Brent futures has recently soared due to increasing supply concerns. The important rebound in backwardation, which started at the beginning of April, is unusual for this time of the year, when global refining activity is low due to seasonal maintenance work. Moreover, this contrasted with a narrower backwardation on NYMEX WTI futures, implying that it only Brent specific factors triggered the upward move in backwardation.
Supply concerns have arisen in North Africa and the Middle East. In Libya, protests have kept crude oil production at around 250’000 b/d, down from 1.2 million b/d in July 2013, despite the restart of 2 eastern oil ports, which were idle since July last year. The confusing election of the new prime minister also clouded the Libyan supply growth outlook.
The general elections in Iraq have also contributed to increase concerns about the political future of the country. In 2010, it took 8 months after the elections for the formation of the current government, while the political situation and sectarian tensions have deteriorated. The Kirkuk-Ceyhan pipeline has been halted since the beginning of March 2014 has militants are preventing works to repair the pipeline, reducing Iraqi crude oil exports capacity, which were already constrained.
The political situation has also deteriorated in South Sudan where about 150’000 b/d of crude oil production is at risk. The civil war has already constrained about 100’000 b/d of output.
In Colombia, attacks against the oil infrastructure have recently increased, leading to the decline in crude oil production in April 2014 to 935’000b/d, the lowest level since August 2012, and down by 100’000 b/d from August 2013 level. The attacks have recently increased due to the peace negotiation between the government and the FARC as the latter wants to be in a position of strength during the negotiation and as smaller rebel groups don’t want to be left aside the negotiations. According to the EIA, global supply disruptions stood above 3.0 million b/d since the beginning of the year, a significantly higher level than these past years. Supply concerns are likely to keep the Brent’s backwardation at a more elevated than usual level for the season.
Fundamentals provide nickel with further upside potential
Nickel has continued its rally and is now up 33% since the start of the year, outperforming by far other base metals. This year, we anticipate the global nickel market to show a small deficit, as supply should be affected by Indonesia’s ban on unprocessed ores.
The question is whether nickel’s impressive rally is justified by fundamentals – and the answer seems to be yes. The Indonesian mineral export ban is set to be very supportive to nickel's prices, not only because it will affect the production of refined nickel, but because it will affect the output of nickel pig iron (NPI). NPI is a low grade ferronickel material, developed by Chinese steelmakers as a cheaper alternative to refined nickel in the production of stainless steel. Producers are currently able to process NPI for a cost of about $18,000 a tonne. This level therefore acted as a floor price for refined nickel, which could not even approach that limit because markets knew that consumers would shift towards nickel pig iron.
This time could be different however. Chinese producers were indeed able to produce high volumes of NPI due to their use of Indonesian nickel ores - the quality of these ores being particularly beneficial in the production process. Appropriate substitutes are almost impossible to find. The Indonesian restrictions on mineral exports, which are most likely here to stay, will increase the importing costs for Chinese NPI producers and reduce NPI’s competitiveness in favour of refined nickel.
Although Chinese NPI producers stockpiled vast volumes of nickel ores in the past months in anticipation of the mineral ban, the Chinese inventories are rapidly decreasing and could only supply NPI producers for a few more months. Furthermore, the rest of the world will not be able to compensate the Indonesian production losses as very few projects are currently able to deliver incremental supply. The production costs of NPI are therefore expected to rise, providing refined nickel with further upside potential.
Concerns on wheat supplies could ease
Since the beginning of the year, US wheat has been the best performer within the grains and was the fourth best performer among commodities. Severe drought conditions in the US, following an extremely cold winter, are expected to lead to reduced yields. This occurred while the deterioration of the political situation in Ukraine is increasing concerns about Black Sea’s wheat supplies. Moreover, weather forecasters are gradually increasing the probability of the occurrence of El Niño, which is expected to have a net negative impact on global wheat supplies.
Nonetheless, these fears, which have pushed wheat prices up by 30% since the end of January 2014, appear exaggerated for now. Indeed, in its latest report, the USDA revised only slightly lower global wheat ending stocks for the 2013/14 season and actually forecasted a rise in global ending stocks to 184.4 million metric ton (+0.5% y/y) for the 2014/15 season, despite the decline of wheat output by 2.4% y/y (to 697.0 million metric ton). This is due to the lower expected demand (-0.9% y/y, to 696.2 million metric ton) as higher wheat price is encouraging the use of substitutes such as corn, of which demand is expected to rise by 1.8% y/y. Wheat prices could therefore suffer a setback before the supply concerns become more tangible.
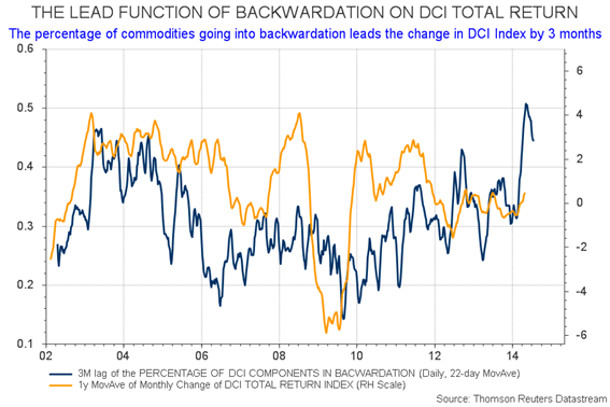
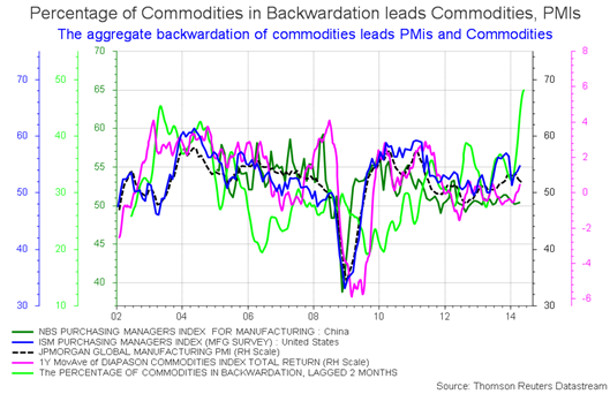
Chart of the week: Backwardated markets hint to higher commodity prices
|
Backwardation usually reflects a tight supply/demand balance and is typically occurring while prices are rising. Moreover, it could be used to anticipate prices’ move. Empirical research shows that the share of the amount of commodities in backwardation can forecast future commodity prices by 3 months for the DCI. Acute backwardation was a factor in the sharp run-up of commodity prices in late 2007 to late 2008. Individual commodity backwardation has also been shown to be a determinant of that commodity contract's future returns (the correlation between width of backwardation and direction of prices is positive). Since backwardation operates through the utilization of supply and its consequent rate of depletion, it also follows that the extent of backwardation can forecast future industrial and manufacturing trends — as the chart below shows, it leads the Global PMI by 2 months. The significant amount of commodities futures in backwardation are signalling tight fundamentals across the board, adding upside pressure on commodity prices. |
|
|
For the full version of the Diapason Capital Markets report, please contact info@diapason-cm.com