
May 5, 2014
The US economy continues to recover, providing a lift for commodities
Commentary by Robert Balan, Senior Market Strategist, Alessandro Gelli, Energy Analyst, Marion Megel, Metals Analyst
"On the face of it [April 2014’s non-farm payroll data], these numbers are definitely good and a confirmation that all the weather-related distortions are a thing of the past”
Ian Gunner, Altana Hard Currency Fund, May 2nd, 2014
Weak US GDP growth in the first quarter of the year contrasted with the good performance of the commodity sector. The later is typically sensitive to growth especially from large economies and this divergence could hence be considered as unusual. Moreover, it appears that the extremely cold winter in the US in the first months of the year had a net positive impact on commodity prices, while it harmed US economic activity. Domestic demand for space-heating and commodity supply disruptions caused by the Arctic Polar Vortex conditions indeed offset slower demand from the industrial sector. Furthermore, commodity prices also benefited from a deteriorating geopolitical environments as supply risks increase.
Recent positive numbers in the US indicate stronger economic growth as the negative effects of the bad weather in Q1 dissipate. This is being suggested by the rise in the April PMI to 54.9 (compared with 53.7 in March) and the latest jobs data. In April, US unemployment fell to 6.3% the lowest level in 6 years. We think that the economy will grow further, bringing the Q2 GDP higher. Growth should extend to Q3, when US GDP could grow by 3.0-3.2%, which could also encourage re-stocking of currently low inventories. This should occur while global macro-conditions also improve. With the exception of Russia, growth seems to be picking up in all major emerging markets. This environment is supportive for global commodity demand growth.
Although non-OECD countries account for the bulk in commodity demand growth, the US remains one of the largest consumer of commodities. Commodity prices are hence sensitive to its economic health. The US is indeed the world’s largest consumer of oil, accounting for almost 20% of global consumption, the second largest consumer of coal, with about 12% of global use, the most important user of corn, accounting for about 30% of global consumption and it is the world’s third consumer of copper after China and Europe, with a share of about 8% of global demand.
The expected acceleration of the US economic activity in Q2 onwards is likely to have a positive impact on the demand of commodities, especially industrial commodities. Oil prices are likely to benefit the most from the improved activity in the US due to its large share of the global oil market. Within the petroleum sector, gasoline prices could outperform other oil products as the US accounts for about 40% of global gasoline consumption and US gasoline inventories have already fallen by a more rapid than usual amount these past few weeks to a relatively low level. Last week’s correction in gasoline prices due to the larger than expected rise in gasoline inventories offer hence interesting buying opportunity.
The improved economic situation could also give a push to base metals prices, which are benefitting from an improving international environment and supply disruptions. Moreover, weather disturbances could soon appear again in the form of El Niño, adding further upside pressure on commodity prices, especially on the agriculture sector. On the other hand, not all the individual commodities may benefit from the improved US economic situation. Gold prices could underperform other commodity sectors due to the historical negative impact of stronger US economic growth on the metal as demand for safe-haven assets tends to diminish with growth prospect.
 |
Main drivers this week
|
Commodities and Economic Highlights
Commentary by Robert Balan, Alessandro Gelli and Marion Megel
Major oil projects hit with delays
The Kazakh government has recently announced that the massive $50 bn Kashagan oil field is unlikely to restart operations before the end of 2015 or 2016. However, some industry sources are even less optimistic and estimate that, due to the complexity of the field, production will not restart before at least 2016 and possibly 2017. The Kazakh oil field was started in September last year, with an initial capacity of 75’000 b/d, after 10 years of development and was rapidly shut due to a leak of hydrogen sulphide, a highly-corrosive toxic gas. The difficulties to handle this toxic gas, which accounts for about 17% of the field’s natural gas output, may force the oil companies’ consortium to replace pipelines with a special alloy. It could take two years to complete the new pipelines, reducing Kazakhstan’s oil production growth outlook.
This is not an isolate case, other major oil projects are facing difficulties. Norway’s Statoil delayed last year the start of the major Johan Sverdrup field offshore Norway by one year to late 2019, with a production capacity of about 315’000 b/d. Moreover, it recently reduced the resource estimate of the field, which was discovered in 2010 and was the largest discovery in Norway since 1974 (and the third-largest ever). These delays come on top of the cancellation of large oil projects. In November 2013, Chevron said it was not economically viable to proceed with investment on the $10 billion Rosebank oil project.
These delays or cancellations are due to the growing complexity of such fields, amid rising costs for equipments and qualified labour, and have contributed to reduce supply growth outlook in some regions. This is contrasting with impressive production growth from US tight oil fields operated mostly by small and medium-sized oil companies.
Can sanctions affect Russian oil and gas supply?
After Iran, it is now Russia which is subject to US and EU sanctions. These have for now affected people close the Russian president and some state-owned companies such as Bank Rossiya. Russian oil and gas companies’ operations have not been directly affected by these sanctions. While the current political situation has already negatively affected the investment climate, these are having for now little impact on Russian oil and gas exports. But even if new US and/or EU sanctions are directly aiming at Russian oil and gas companies, the impact could be at first marginal, especially on the oil sector.
Indeed, the Russian oil industry has already been reducing its exposition to the European oil market for several years. Russian crude oil exports to Europe have fallen to 3.8 million b/d in 2013, down almost 1 million b/d from 2009 level, due to stronger domestic demand and rising crude oil exports to Asia, which accounted in Q1 2014 for 21.0% of Russian crude oil exports (compared with 0.9% in 2009). This is due to improved infrastructure in Eastern Siberia.
On the other hand, the Russian gas market remains heavily dependent on European gas exports due to limited capacity to export the gas elsewhere. In 2012, Europe accounted for 90% of Russian natural gas exports to non-former FSU countries. Russia has been negotiating with China for a decade about a major gas deal, that could allow it to export natural gas to China. The current European and US pressure over Russia is increasing the Chinese bargaining power over such gas deal. However, it would take several years before the capacity to export gas to China from Russia would become operational.
Furthermore, despite the importance of Russian gas imports in Europe as it accounts for about a quarter of European natural gas consumption, current elevated natural gas inventories in Europe, lower seasonal demand, and a looser global LNG market make the European gas market less vulnerable in the short run to a reduction in Russian natural gas imports.
India’s gold demand recovering
Over the past months, India’s gold demand has been particularly poor, as a result of high domestic prices and import restrictions. It appears that the situation is changing and could improve further in the coming months.
Firstly, imports rebounded in March, following six months of very low import levels. The country’s official gold imports are estimated around 50 tonnes, the highest level since Q2 2013 and compared with only 10 tonnes imported officially in September last year. March’s import levels were back in line with the lows of the 2011-2012 import range (42-160 tonnes), hence exiting the unusually low volumes seen in the past six months. One reason could be the fact that the Indian central bank renewed licenses of 21 banks, which accelerated their imports before the quotas deadline on March 31. Furthermore, sales of gold jewellery have increased. According to Societe Generale, the average daily sales are currently 8% to 10% higher than the average seen in the first quarter this year.
India’s future gold demand prospects appear also brighter. We have entered the Indian election period, which should last until mid-May and should revive debates about gold import restrictions and duties. The government has already showed some willingness to ease restrictions in order to restrain black market sales, which are estimated to have soared in the past months.
The upcoming elections should encourage further gradual easing of rules, according to industry experts. However, one should not expect imports to return to the 2013 peak as the government will probably want to avoid such strong deficits.
The cocoa market is likely to be in a deficit for the second year in a row
Agriculture prices have been the best performers within the commodity markets since the beginning of the year. Within the agriculture sector, soft commodities outperformed. The Diapason Commodity Index® Soft Total Return is up by 20.9% YTD. Among the drivers of this sub-sector, coffee and cotton prices an upward move larger than 10% since the beginning of the year. Another strong performer since the start of the year is cocoa, whom prices are up by about 9% YTD.
Last year, cocoa prices also rose by almost 20% as the market moved in a deficit for the first time since 2009 due to a rebound in demand and fears of adverse weather in West Africa. Fundamentals continue to be supportive for cocoa prices. During Q1 2014, cocoa grinding in Asia rose by 3.7% y/y due to stronger demand for chocolate-based confectionery and beverages. This triggered an increase in grinding capacity in Indonesia. Cocoa demand is also increasing in developed countries. Cocoa grindings is estimated to have increased in Q1 2014 by 1.8% y/y in North America and by 0.4% y/y in Europe. Global grindings are expected to reach during the 2013/14 season (October-September) 4.2 million tonnes, up 2.5% y/y.
On the other hand, despite dry weather in West Africa cocoa production is expected to rebound during this season to 4.1 million tonnes, up 4.1% y/y, driven by stronger output in Ivory Coast (+7.0% y/y), which accounts for almost 40% of global cocoa output. Persisting dry weather could lead to a lower output in this country. But even without a downward revision in output, the cocoa market is expected to move into deficit for the second year in a row. This should bring cocoa inventories to 1.6 million tonnes, a low level compared with demand. Indeed, the stocks-to-grindings ratio is expected to decline to 37%, one of the lowest level of the past 15 years. However, the deficit could even be greater than expected due to the possible occurrence of El Niño that could bring drier weather to West Africa, reducing yields. Cocoa prices hence continue to be supported by strong fundamentals amid growing risks of further weather disturbance.
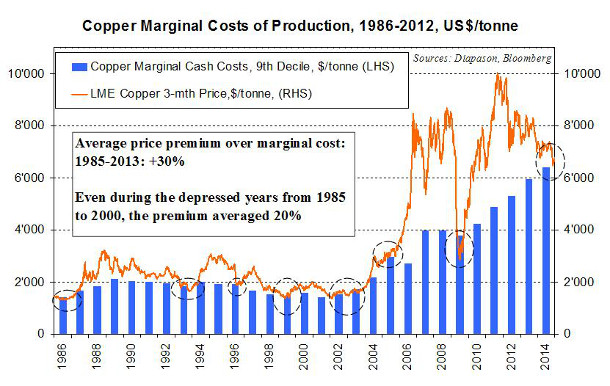
Chart of the week: Copper being only 5% above the marginal cost of production is an anomaly in regards to recent history
|
Copper’s performance has been relatively poor this month. The metal has gained only 0.9% since the start of April, compared to returns as strong as 13% for nickel or 4.5% for zinc. Since the price collapse that followed Chaori Solar’s default on March 7 this year, copper has not been able to recover and remains nearly 5% below its early 2014 levels (despite the 4% gain since its March 11th low level). We view the current copper price has unsustainable and expect a recovery over the coming months. Indeed, the red metal’s price currently exceeds the industry’s marginal cost of production by only 5%. This appears like a very low premium in regards to the past years: since 1986, the copper price premium over its marginal cost averaged 30%. Even during the depressed years from 1985 to 2000, this premium averaged 20%. The few times when the copper price hovered around the industry’s production cost have been rare, especially compared to other metals such as nickel or aluminium. These periods also rarely exceeded a few months (except for the periods 1985-1986, 1993-1994 and 2002-2003). Since the start of the commodity super cycle in the early 2000’s, this is only the third time that copper is negotiated at such low levels compared to its marginal cost (after 2005 and 2009). The current low premium is the result of a falling copper price—not of rising production costs. Although costs have strongly risen in the past years, the increase has been steady and unsurprising. It is only the second time in the past decade that such low premiums are reached because of a price collapse—and the first time was during the 2009 crisis. |
|
|
For the full version of the Diapason Capital Markets report, please contact info@diapason-cm.com