
April 7, 2014
Stronger demand growth and low inventories should move oil prices higher
Commentary by Alessandro Gelli, Energy Analyst
"For 2014, global oil demand is expected to average about 92.7 mb/d, up by 1.4 mb/d (or 1.5%) on the year earlier. [...] Overall demand momentum is forecast to accelerate, albeit modestly, in 2014, supported by a strengthening global macroeconomic backdrop.”
International Energy Agency, Oil Market Report, March 2014
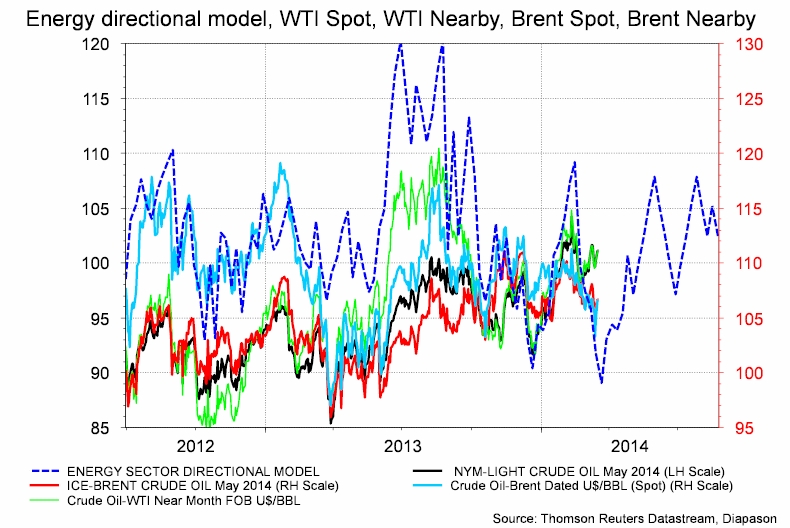
Since the beginning of the year, Brent prices have remained in the $105-$112 per barrel range. Following the price decline in March, Brent prices could soon reach a bottom and then rebound towards the upper side of the range. In January and February 2014, cold weather in the US contributed to add upside pressure on oil prices through strong heating fuels demand, which more than offset lower demand from the transportation sector. Warmer temperatures in March — which led to lower demand for petroleum products — and stronger Iraqi crude oil exports contributed to the downward move in Brent oil prices. These events occurred while Libyan crude oil exports remained constrained by protests and political instability. Disrupted Libyan crude oil production has contributed to the strength in Brent prices since July last year and continues to play a key role in the oil pricing structure. Recent developments in Libya are suggesting that Libyan crude oil exports could soon rebound and hence have a negative impact on oil prices. The possible rebound in Libyan crude oil exports, while the global oil demand is close to its seasonal lows, could trigger one last downward move in oil prices.
The medium-term outlook appears however more positive for oil prices. Global oil demand is increasing at a more rapid pace, while petroleum products inventories are at a low level. Strong growth in US oil demand and the improved economic situation in other OECD countries have triggered since the middle of 2013 the strongest rise in OECD oil demand since 2010. Indeed, in the second half of 2013, OECD oil demand grew by 420’000 b/d y/y according to the US government. This has offset slower growth from non-OECD countries, which fell to +680’000 b/d y/y during the same period, while it rose by 1.1 million b/d in 2012. Moreover, the US government estimated that OECD oil demand grew by 350’000 b/d y/y in Q1 2014 amid stronger growth from non-OECD countries (+1.1 million b/d y/y).
Among non-OECD countries, China is likely to see a more rapid growth in oil demand. Indeed, contrasting with the second half of last year when Chinese oil demand growth fell to +60’000 b/d y/y, the latter is estimated to have risen to 110’000 b/d y/y in Q1 2014 and is likely to reach +620’000 b/d y/y in Q2 2014 and +630’000 b/d y/y in Q3 2013, driven by stronger demand for gasoline, kerosene and petrochemicals feedstock. This is due to the expected acceleration of the economic activity as the central government is currently implementing stimulus measures. The improved situation in OECD and non-OECD countries has led the International Energy Agency (IEA) to revise higher last month its forecast for global oil demand growth to 1.4 million b/d, the strongest growth since 2010.
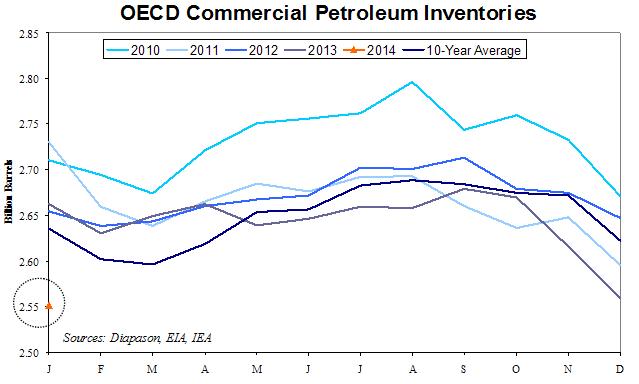
But the major difference with 2010 is that at that time oil inventories stood at a high level at 2.73 billion barrels on average, due to the financial and economic crisis of 2009 that led to a significant reduction in demand for petroleum products. On the other hand, petroleum inventories are currently at a low level (see chart of the week). OECD oil inventories dwindled by 1.5 million b/d in Q4 2013, the steepest decline since 1999. Moreover, according to the IEA, OECD inventories counter-seasonally fell in January to 2.55 billion barrels, the lowest level since May 2004 due to strong heating fuels demand. Thus, even if Libyan crude oil exports rebound and remain at a higher level than the previous months, the acceleration in global oil demand growth in the coming months amid low petroleum products inventories is likely to contribute to an important upward move in oil prices. The oil market is likely to be exceptionally tight between June and August when global demand for petroleum will reach its seasonal highs. This should allow Brent oil prices to move towards the $115-$120 per barrel area by August 2014.
 |
Main drivers this week
|
Commodities and Economic Highlights
Commentary by Robert Balan, Alessandro Gelli and Marion Megel
US ethanol prices move to the highest level in 8 years
US ethanol prices reached $2.8 per gallon at the beginning of the month, the highest level since July 2006, and moved above US gasoline prices due to a combination of factors. First, demand for ethanol in the US has increased due to the strong rise in US gasoline demand, which stands at the highest level since 2010. Indeed, as more gasoline is used, more ethanol is required. Ethanol's use reached 850’000 b/d two weeks ago, the highest level for this time of the year. Since the start of the year, US ethanol consumption has risen by 3.1% y/y.
Moreover, logistical issues have contributed to the rise in ethanol prices. There is currently a lack of railway tank cars to transport ethanol from the Midwest where it is mostly produced to refineries on coastal regions. This is due to the important demand for railway tank cars to transport crude oil. According to the Association of American Railroads, the amount of carloads of crude oil rose from just 9’500 in 2008 to 234’000 in 2012 and to an estimated 400’000 carloads in 2013 (about 1 million b/d or 13% of US crude oil production in 2013).
Stronger demand and supply constraints are occurring while ethanol inventories are at the lowest level for the season in at least 4 years as they fell in March below 16 million barrels. These past three years, ethanol inventories averaged 20.2 million barrels during the month of March. Thus, despite the recent correction in ethanol prices to around $2.4 per gallon, the latter should remain at an elevated level due to the logistical issues and increased demand from refineries. In turn, this is adding upside pressure on gasoline prices as it increases costs for refiners to produce finished motor gasoline.
Gold investment outflows resume
Gold prices have been on a downward trend over the past two weeks. Janet Yellen’s dovish comments suggesting a possible earlier-than-expected hike in interest rates have stopped gold’s rally. Although the Fed reaffirmed on March 31 that the US economy and job market still require firm support from the central bank’s low interest rate policy, the damage was already done to the yellow metal.
Over the past months, the tapering process has been the main driver underpinning the gold price. Furthermore, as the situation has not particularly worsened in Ukraine, safe haven investments have eased too. In addition, the US dollar has rebounded following Janet Yellen’s comments: the DXY has risen from 79.385 on March 17 to 80.094 on April 1st, 2014.
Investors have therefore started to withdraw from the gold market. According to Bloomberg data, the world’s gold ETFs have seen outflows in the past days, following nearly two months of inflows. On March 31, ETFs holdings were down 0.57% w/w, the highest week-on-week outflow since the end of January this year. On the Comex, net long speculative positions have also retreated to 145,531 lots last week, compared with 172,204 in the week before. Long positions indeed declined from 202,885 to 184,632 lots, while shorts increased from 30,681 to 39,101 over the week.
Indonesia’s mineral export ban is most likely here to stay, supporting nickel
Nickel has surged 17% year-to-date, outperforming other base metals. Such a rally marks a turning point for nickel, which has been in surplus during six of the past seven years. This year, we anticipate the global nickel market to be balanced, on expectations that supply will be affected by Indonesia’s ban on unprocessed ores. Indonesia is the world’s largest exporter of nickel and supplies about 30% of the world’s needs for the metal.
The ban is most likely here to stay. The Indonesian elections will run in July and each party is in favour of export restrictions. Also, some producers have already started to build refining plants (as only refined metals can be exported), so political leaders now bear a responsibility towards those industrials, who are aggressively spending into fixed assets.
This ban is set to be very supportive to nickel's prices, not especially because it will affect the production of refined nickel (inventories are still high), but because it will affect the output of nickel pig iron (NPI). NPI is a low grade ferronickel material, developed by Chinese steelmakers as a cheaper alternative to refined nickel in the production of stainless steel. Producers are currently able to process NPI for a cost of about $18,000-$19,000/t. This cost provides Chinese steelmakers with a competitive advantage as soon as refined nickel prices exceed that level. Therefore, nickel is usually constrained by this arbitrage as its price can hardly exceed the NPI cost for too long.
This time could be different however. Chinese producers were indeed able to produce high volumes of NPI due to their use of Indonesian nickel ores - the quality of these ores being particularly beneficial in the production process. Substitutes are difficult to find. The Indonesian restrictions on mineral exports, which most likely are here to stay, will increase the importing costs for Chinese NPI producers and reduce NPI’s competitiveness in favour of refined nickel.
A change in China’s policies over cotton could lift inventories globaly
China may change its policies over cotton this year and this could prove negative for cotton prices. The reason for China’s possible lesser intrusion in the domestic market may be the fact the Chinese cotton stocks in 2013/14 are estimated at 160% the domestic annual consumption, the highest level in history. Although the change in the country’s cotton policy could reduce domestic inventories, it could also inflate stocks in the rest of the world, bringing downward pressure to prices.
China’s cotton policy is built on three pillars: output, import quotas and State reserves. Chinese officials have already indicated they could reduce direct subsidies by as much as 25% to farmers in Xinjiang, the country’s largest cotton producing region. This should result in lower Chinese production over the coming months (supportive as it could lower domestic stocks).
However, the changes in the other two pillars could inflate non-Chinese stocks globally. As far as the trade policy is concerned, policymakers appear to be willing to reduce imports, which could hurt export sales in the ROW. Regarding the State reserves management, it appears that officials are willing to sell the inventories to the domestic market at prices closer to the international prices, to encourage local consumers to buy domestically rather than from overseas.
Therefore, a slow but steady decrease in Chinese reserves can lower imports and therefore increase inventories in the rest of the world. The USDA expects that the ending stocks ex-China will grow by 25% this season, from circa 38.5 to 48.5 million bales. On the other hand, China is set to represent “only” 54% of total stocks, vs. 60% in the prior season.
Chart of the week: OECD petroleum inventories are at dangerously low level
|
According to the IEA, OECD petroleum inventories fell further in January 2014 (-13.2 million barrels m/m), following a major drawdown in Q4 2013. This was also contrasting with the 43.4 million barrels build in inventories on average these past five years. This contributed to widened the deficit with the five-year average to 154 million barrels, from 97 million barrels in December 2013. This is the largest deficit since February 2003. It is interesting to note that all OECD regions are in a deficit with the five-year average. The drawdown in January was unexpected. This was due to the extreme cold weather in North America that led to soaring demand for heating oil and propane. This has contributed to bring OECD petroleum inventories to 2.55 billion barrels, the lowest level since May 2004. Inventories are at a dangerously low level considering that global oil demand is expected to rise by 1.4 million b/d y/y (according to the IEA), the strongest rise since 2010. ”
|
|
|
For the full version of the Diapason Capital Markets report, please contact info@diapason-cm.com