
March 31, 2014
China unveils a fresh round of infrastructure stimulus
Commentary by Senior Market Strategist Robert Balan
"For years to come, there will be one per cent increase in China’s urbanization rate every year as several hundred million Chinese farmers will migrate into the cities. (…) But there are no urban slums in China precisely because we have been able to maintain growth and provide job opportunities.”
Xi Jinping, January 2014
A year after Xi Jinping took control of China, his government has revealed last week an ambitious urbanization plan that will allow 60% of the country’s population to live in cities by 2020, from 52.7% currently. In other words, each year until 2020, 16.4 million people (twice the population of London) are expected to move from the rural hinterland to cities.
With growth slowing down and stresses starting to rise in the financial system, the Li government has moved to initiate another round of stimulus based on infrastructure spending. Despite the current official line on transitioning to a market based economy, China’s leaders continue to insist that investment levels should be strong enough to guarantee employment and political stability.
China's new preferred solution to infrastructure spending is an urban renewal with an emphasis on transportation and energy - a solution which was endorsed by the World Bank. According to the Financial Times newspaper:
- The government plans to ensure that every city with more than 200,000 residents will be connected by standard rail and express roads by 2020, while every city with more than 500,000 residents will be accessed by high-speed rail.
- New airports would be built to ensure that the civil aviation network covers about 90% of the population.
- The plan also calls for the redevelopment of 4.75m household units in rundown shantytowns this year alone, with an expected total cost of Rmb1tn ($163bn).
Also, according to CEIC, the NDRC has approved five railway projects, accounting for 22.1% of the 2014 investment target of CNY631bn set by China Railway Corp. To carry all these projects out, the central government targets a budget deficit of CNY1.35trn in 2014 (2.2% of GDP), up from the 1.9% which was reached in 2013. This agenda also comes on top of local governments’ own development plans (especially in the Zhejiang province).
These new activities should have a positive impact on metals in particular as these could materialize into orders as early as in Q2 and Q3 this year. We can already see the positive impact of China’s infrastructure plans: China’s grid investment started the year strong, growing 22% y/y in the first two months of 2014. This growth was significant because it was achieved despite a high base – in January-February 2013, investment rose 44% from a soft 2012. Furthermore, January-February usually account for less than 10.2% of the annual total. (Source: CEIC)
In addition, initiatives have been taken to help companies access capital more easily in the property market. On the monetary side, expect the PBoC to maintain easier liquidity conditions in latter part of H1 2014: expect relatively low interbank interest rates, RRR cuts and the CNY to stay weak.
We do not expect Premier Li to be embarrassed by GDP data — growth in H1 2014 should be at the upper range of the 7.0%-7.5% band that Mr. Li has pencilled in himself.
 |
Main drivers this week
|
Commodities and Economic Highlights
Commentary by Robert Balan, Alessandro Gelli and Marion Megel
US gasoline use is rebounding back to the elevated levels of Q4 2013
While the cold winter had a negative impact on the US gasoline market, current warmer temperatures are allowing a significant rebound in gasoline demand, adding upside pressure on gasoline prices. Implied gasoline demand estimated by the EIA indeed reached 9.0 million b/d last week, up by 600’000 b/d y/y and the highest level since the end of 2013. US gasoline demand rose to around 8.9 million b/d in Q4 2013, stronger than the high levels of 2011 and 2012 when it averaged 8.6 million b/d.
This was due to increasing miles travelled. According to the US government, the 12-month rolling average of vehicle-distance travelled reached 2’972 billion miles in December 2013, the highest level since February 2011. So far this year, although the cold weather affected travel in January and February, warmer temperatures in March are likely to have contributed to a rebound in miles travelled.
The acceleration of the economic activity and relatively low gasoline prices at the pump have been the major factors behind the recovery in miles driven at the end of last year. Between October and mid-February 2014, retail gasoline prices in the US stood between $3.2 and $3.5 per gallon, which is the bottom of the price range observed since 2011. Weak gasoline prices came at a time where the economic activity was accelerating in the US. The recent rise in gasoline prices to $3.6 per gallon may have negatively affected demand. Nonetheless, this is mitigated by the persisting strength in the US economy. Thus, gasoline demand is likely to rebound from its January and February lows to levels closer to Q4 2014. The strength in domestic and foreign gasoline demand is reflected by the more rapid than usual decline in US gasoline inventories, which dwindled by 15.9 million barrels since mid–February, compared to an average decline of 10.8 million barrels on average in the previous five year. Strong demand is likely to maintain upside pressure on gasoline prices.
No sign of a massive copper physical sell off so far
Since Chaori Solar’s default on March 7, 2014, the copper price has fallen to its lowest level since mid-2010. Markets have remained concerned that financing deals involving copper as collateral would end in China, which would potentially lead to a leak of copper inventories onto the physical market and create a massive surplus. These fears appear overdone. So far, nothing indicates a physical sell off in the copper market.
It is true that during the week commencing March 10, some physical sell off was observed. However, the likely reason for this was probably the fact that SMEs were willing to settle their liabilities in order to maintain constant leverage ratios on their balance sheets, following the drop in the copper price (in the value of their collateral). However, most companies involved in those financing schemes are hedged, meaning that there is little incentive to sell the copper back in the spot market.
The market is still in backwardation at the LME (although to a lesser extent) and in China, indicating a relatively tight spot market. This does not seem compatible with a panic sell-off. Furthermore, premiums are holding firm. Although the Shanghai Grade A copper cathode premium has declined over the past three weeks, it is still double its levels a year ago. In the rest of the world, it is business as usual: premiums in Europe (Rotterdam Grade A cathode) have been gradually increasing, while those in the US (Copper High Grade cathode) rebounded last week to their highest level since October 2013.
We do not expect financing deals to end in the near term nor the physical inventories to be massively released onto the spot market. These fears are overdone in our opinion.
How long can the market ignore platinum’s supply issues?
Platinum has underperformed the precious metals complex on the Comex since the start of the year. The metal has risen by just over 2.2% YTD, equalling the performance of silver but lagging behind gold (+7.5%) and its peer-metal palladium (+7.5%). The platinum/palladium ratio is now at its lowest level since 2001. Given the ongoing severe supply disruptions in South Africa, we can only be surprised by platinum’s disappointing performance.
We have been advocating over the past months that palladium’s fundamentals are stronger. The leading statistic provider, Johnson Matthey, estimates that both markets are in deficit; but while most of the palladium deficit is industrial, platinum’s shortage largely results from investment demand in the form of ETF, which is nothing more than stockpiling of the metal.
This being said, the supply picture has changed a lot in the past months. The current strike hitting the South African PGM mining sector, which was expected to be of short nature, has entered its eighth week. Wage talks have failed and no agreement is on sight. Miners’ last offer included wage increases of up to 9% but this one was rejected by unions, who are demanding wage hikes of 25-35% per year over a four-year period.
The damage is enormous: platinum production losses could amount to 450,000 ounces approximately, or 7% of the world’s 2013 output. For platinum miners, the combined loss cost could amount to $1bn. We expect platinum to outperform palladium in the coming months.
Russia’s annexation of Crimea should not significantly hurt Ukraine’s grain exports
Since the unrests have started escalating in Ukraine in mid-February 2014 with the Sochi Winter Olympics, corn and wheat prices have been on the rise on fears that growing tensions would lead to disrupted exports from Ukraine, aka “the bread basket of Europe”. Ten days after Russian President Putin signed the Crimea annexation treaty, we can now say that the conflict hasn’t had any impact on agriculture supply from the region so far.
Indeed, since the start of the 2013/2014 season, corn exports from Ukraine have largely exceeded the levels seen in the two previous seasons. The fact is that grains are mostly shipped via Odesa and Mykolaiv’s ports and not from Crimea, where the peninsula’s ports are mainly used for grain storage, according to Macquarie. According to the Ukrainian Agrarian Confederation, corn exports since the start of the season have nearly doubled their 2012/2013 season levels. The USDA estimates that corn exports this season will be 45% higher, from 12.73 million tonnes. Exports of wheat should also be higher this season, by approximately 39% according to the USDA.
The main risk for Ukrainian grain output should remain the weather conditions, as concerns over a possible drought have emerged recently. In addition, farmers should also face higher production costs due to the likely hike in energy prices in the country.
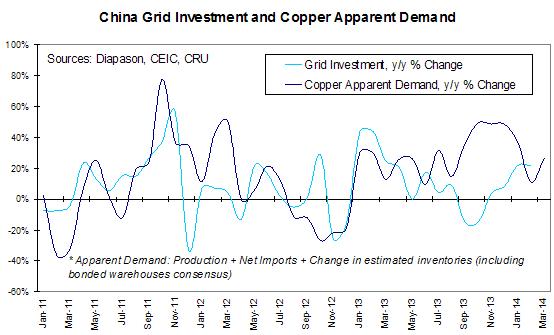
Chart of the week: China’s infrastructure plan should support copper demand from Q2-Q3 2014
|
As discussed in our main commentary here above, China has unveiled an important infrastructure plan last week, which will allow 60% of the country’s population to live in cities by 2020, from 52.7% currently. Unlike previous plans set under Hu Jintao’s presidency, this one should emphasize on transportation and energy access, and not primarily on building construction. In particular, the government is targeting railways, airports and power grids as strategic infrastructures. This plan is expected to translate into orders of industrial metals, especially copper (mostly used in power grids and railways) as early as Q2 this year. The trend has already started since the China Electricity Council reported that grid spending was up 22% y/y in the first two months of 2014. This growth was significant because it was achieved despite a high base - in January-February 2013, investment rose 44% from a soft 2012.Electric grid companies, on year-on-year basis, added 11% more transmission lines and 61% more transforming capacity. To make a realistic comparison, absolute levels of capacity addition are generally seasonally low at the beginning of the year, with the first two months usually accounting for less than 10.2% of the annual total. (Source: CEIC) The strong grid capacity addition should help dispel some doubts over copper demand. A pickup in copper demand could be expected once the new investment outlays translate into orders, possibly this coming quarter. ”
|
|
|
For the full version of the Diapason Capital Markets report, please contact info@diapason-cm.com