
February 17, 2014
OECD petroleum inventories decline the most since 1999
Commentary by Senior Market Strategist Robert Balan, Metal Analyst Marion Megel, Energy Analyst Alessandro Gelli
"Far from drowning in oil, markets have had to dig deeply into inventories to meet unexpectedly strong demand"
International Energy Agency, Oil Market Report, February 2014
The Eurozone GDP data were the last confirmation of the acceleration of the economic activity in Europe which followed the path of the US economy. And the improved economic environment is gradually tightening commodity markets. The most recent “flashpoint” is the crude oil market, which benefitting greatly from the acceleration of activity in the US, Japan and in Europe. In fact, this has caught the oil industry flat-footed, leading to a significant decline in petroleum inventories, as supply is used up faster than previously anticipated. As an example: last week, the International Energy Agency revised higher global oil demand growth for 2014 by 50’000 b/d to +1.3 million b/d y/y, the strongest annual growth since 2010. This was the third consecutive upward revision due to improved economic conditions in OECD countries. In fact, this has more than offset weaker outlook for non-OECD countries. The IEA indeed cut off 80’000 b/d from the first quarter non-OECD demand estimate.
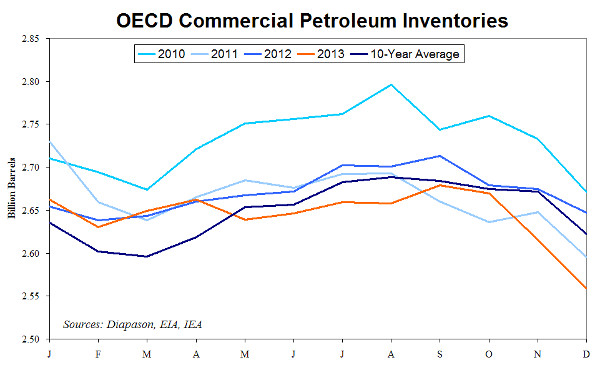
The IEA also pointed out that OECD commercial petroleum inventories (crude oil and petroleum products) dwindled by a large amount in December (-56.8 million barrels over the month), leading to a stock draw of 1.5 million b/d in Q4 2013. This was the steepest quarterly decline since Q4 1999. OECD petroleum inventories reached 2.56 billion barrels, down 3.5% from the 5-year average, and the lowest amount for this period since 2004. The large drawdown was due to the stronger than expected demand especially from OECD countries. According to preliminary data from the US Government, US oil demand rose by 700’000 b/d y/y in Q4 2013 and by 320’000 b/d y/y during the all year, the strongest annual growth since 2010. Moreover, European oil demand has improved significantly last year and is estimated to have decline by only around 200’000 b/d y/y, compared to an annual drop in demand of nearly 600’000 b/d in 2012 and about 400’000 b/d in 2011.
Petroleum inventories have fallen sharply to relatively low level while global oil demand growth is expected to rise to the highest level since 2010. The oil supply/demand balance is hence tightening amid low inventories to respond to an unexpected drop in supply or acceleration of demand, adding upside pressure on oil prices. We see these opportunities persisting for some time as emerging countries could soon take back the lead. The global macro outlook indeed unfolds as a sequence — first the developed economies pick up speed, and then the less developed economies catch the windfall. That may be the case again, as China shows signs of rising out of the doldrums of the past several quarters. Chinese exports have picked up in January, and not all of it can be attributed to Lunar New Year distortions. The reality is that the second-round effects of the growth seen out of the US, Japan and the Euro Area last year are about to cascade into EM economies, which should globalize the improvement in economic activity currently seen in OECD countries. That should impact commodity demand as well, as is now being seen in the oil market. The tightness in this sector is reflected by backwardated markets across the sector. The Diapason Commodities Index® is up by 1.7% year-to-date and has room to move higher.
 |
Main drivers this week
|
Commodities and Economic Highlights
Commentary by Robert Balan, Alessandro Gelli, Marion Megel and Alban De Rougé
Large disruptions add to oil supply forecast’s uncertainty
Last year, unplanned oil supply disruptions reached extremely high levels. They averaged 2.6 million b/d over the year and 3.0 million b/d in the second half of the year. At 3.0 million b/d in January 2014, unplanned crude oil supply disruptions estimated by the US EIA, remained at an elevated and contributed to stable oil prices.
Another consequence of the large amount of crude oil production outages is the growing uncertainties related to oil supply growth’s forecast. Indeed, an important amount of these outages have appeared due to political situation. The change in political situation is indeed significantly more difficult to forecast than the resolution of technical or legal issues. For example, in Libya prolonged strikes at oil ports and protests around oil infrastructure led to a decline in Libyan crude oil production to 0.2 million b/d in November 2013, down from 1.4 million b/d in April 2013. The restart of a major oil field in the western part of the country allowed Libyan crude oil production to recently rebound to around 0.5 million b/d. Nonetheless, a political solution is still required to unlock crude oil exports from the eastern part of Libya. Thus, the outlook of Libyan crude oil production is tied to the government’s ability to find a political solution with groups that are asking for more regional autonomy.
In Nigeria, oil theft, armed groups and oil unions (that have recently threatened to shut down crude oil production) are also major uncertain factors to take into account for the Nigerian crude oil production’s outlook. Crude oil production outages in Iran are dependent on the result of the negotiations between Iran and the P5+1 countries. In Iraq, sectarian violence has recently increased and is likely to remain high with the general election of April 2014.
The rebound in crude oil production in South Sudan, Syria and Yemen is also tied to negotiations between different political groups. The high political uncertainty is likely to persist until at least the middle of the year when international sanctions against Iran may be lifted.
Will Brent’s backwardation lasts ?
The price of Brent crude oil remained in the $105-$110 range since the beginning of the year as the impact of supply concerns was offset by weaker economic data. On the other hand, Brent’s backwardation has risen to the highest level since October 2013, suggesting a tighter oil market
This was indeed caused by strong Asian purchase of European crude oil due to the favourable arbitrage while crude oil supply disruptions remain important. This contributed to offset the impact of weak refining activity in Europe due to low margins European refining margins has recently increased due to strong US demand for European diesel, leading to an increase in demand for Brent domestically as well as from outside Europe. Moreover, on the supply side, Britain’s largest oilfield, Buzzard, faced several unplanned outages.
This may have forced Nexen, the operator, to announce that planned maintenance in Q2 and Q3 2014 will last 9 weeks, 2 weeks more than initially expected. These past years, important planned maintenance work at the Buzzard oilfield were followed by unplanned disruptions as the field failed to restart properly. These growing risks on supply amid stronger demand contributed to the wider Brent’s backwardation.
The end of the Chinese New Year Holiday and the subsequent rebound in industrial activity could lead to stronger Chinese crude oil imports. This should contribute to a wider Brent’s backwardation in the coming days.
Nonetheless, the start of the refining maintenance season in Europe in March, which will be followed by Asian refiners in April-May, is likely to gradually add downside pressure on the Brent’s backwardation. Furthermore, technical issues at the 200’000 b/d Buzzard oilfields have a higher probability to arise only once the planned maintenance period is over by mid-Q3.
China’s copper imports hit record high in January on restocking activity
Last week, the Chinese commodities trade data surprised markets by showing record high imports of copper, iron ore and coal, ahead of the New Year festivities, which ran from January 31 to February 6. In fact, total copper imports in January surged to 536,000 tonnes, up 22% m/m and 53% y/y. The data contrasted with disappointing PMI indicators, struggling metals prices and worries over emerging markets’ metals demand.
Most of this increase is attributable to restocking demand ahead of the New Year – and this fact is not negative for copper as it highlights how desperately China needs to rebuild its copper inventories at the moment. According to the consulting company CRU, inventories held in bonded warehouses could amount to 550,000 tonnes, compared to 400,000 tonnes at the end of the summer. This remains a relatively small amount, in regards to the large production and import volumes reported in the past months, and when compared to the +900,000 tonnes held in those warehouses at the end of 2012.
Refined copper stocks held in SHFE and bonded warehouses represent now 19 days of demand vs. about 21 days in December. Inventory levels could still be insufficient to meet industrial demand as well as financing demand (due to tightening credit conditions, copper financing trades are said to have resumed); so imports should remain high in the coming months.
The data should help ease concerns of a Chinese hard landing. As we approach the high demand season, we still recommend sector exposure.
WASDE report reflects strong progress of the US export sales
On the 10th of February, the US Department of Agriculture (USDA) published a report which reflects the strong progress of the US export sales. Indeed, in its monthly WASDE report, the USDA revised higher the US export forecasts for the major grains: soybean, corn and wheat.
Since the beginning of the season, September 1, 2013, the US have sold 22 million tonnes of soybean. If we add the sales made before September 1, for the season 2013-14, we obtain a total of 43.3 million tonnes or 1’590 million bushels, which is larger than the January export estimate of 1’495 million bushels. Therefore, the USDA revised slightly higher the export forecast by 15 million bushels to reach a record of 1’510 million bushels. However, even with this increase, the estimate is lower than the quantity exported or committed for sale. As a consequence, either the USDA will have to keep revising higher its export forecast in the coming months, or some sales already contracted have to be cancelled. The market continues to expect cancellations by China, but none have been confirmed yet.
For corn, net exports sales through the first 23 weeks of the marketing year have reached, 21.9 million tonnes or 32.7 million tonnes if we add the sales made before September 1, for the season 2013-14. It represents 1’287 million bushels or 91 percent of the USDA's January projection. Therefore, as for soybean, the USDA increased also its corn exportation forecast by 150 million bushels to reach a level of 1’600 million bushels. It means that the US can still sell 313 million bushels of corn during the last 29 weeks of the marketing year before reaching the level estimated by the USDA.
For wheat, the export forecast was increased by 50 million bushels, to a total of 1’175 million bushels. To reach that level, exports will need to average 21.4 million bushels per week during the remaining 16 weeks of the marketing year, slightly less than the average pace to date.
Chart of the week: Petroleum inventories drop amid stronger demand
|
Stronger economic growth in Europe and in the US has contributed to increase global oil demand growth especially in the second half of last year. This unexpected acceleration in oil demand triggered an important reduction in petroleum inventories. According to the International Energy Agency, OECD petroleum inventories fell at the fastest level in Q4 2013 since Q4 1999. Having fallen to low levels amid ongoing strong demand growth is likely to increase the vulnerability of the oil market to a supply or demand shock. This should force Saudi Arabia to again increase crude oil output to high levels especially during the summer when global oil demand will make its seasonal peak. |
|
|
For the full version of the Diapason Capital Markets report, please contact info@diapason-cm.com