
January 20, 2014
Commodities: a cheap hedge against an uptick in inflation
Commentary by Senior Market Strategist Robert Balan
"Invest in inflation. It’s the only thing going up."
Jim Rogers
Strong deflation risks, resulting from the financial crisis, have put aside fears of inflation over the past 4 years. However, mid-2014 could well prove the period when inflation makes its come back. Several factors are indicating that this could be the case, from loose monetary policy to the rise in real estate prices. In turn, the inflationary environment should benefit commodities.
Inflationary pressure is growing in Europe, where the ECB for some time has been mulling the idea of doing true QE (US style) or experimenting with negative deposit rates. Moreover, the UK housing boom, as well as the surge in US housing prices, has been keeping upward pressure on measures of “equivalent rent”, and thereby on core inflation expectations. In Asia, the open-ended Japanese QE shows no signs of ending sometime soon, and China’s PBOC had been willing to let the Yuan rise more rapidly during the recent past, and may also allow more revaluation in the near-future. This will export goods inflation from China to the globe.
In the US, the Federal Reserve is more tolerant of higher inflation, and so some of the recent indicators that show some disinflation will not be allowed by the central bank to morph into outright deflation. Incoming Fed Chair, Janet Yellen share Mr. Bernanke’s abhorrence for deflation and favours a rules-based approach to setting policy rates (the so-called “optimal control”) which at its core is willing to tolerate higher inflation if it allows improvement in employment indicators to optimum levels. That too suggests that the Fed will allow inflation pressures much more leeway to take hold relative to what it will tolerate before the onset of the Great Recession.
The acceleration of global economic growth combined with the presented factors have triggered a rebound in inflation expectations. The 10-year Treasury Inflation-Protected Securities (TIPS) started to accelerate on May 2013 at (-0.62%) and from these extremely low level have soared to +0.92% in September 2013, the highest level since April 2011. Since then TIPS have remained around this elevated level compared with the past 2 years.
In this environment, commodities as a hard asset should naturally perform well as the rise in inflation affects commodities through two channels. First, the rise in inflation has usually a negative impact on the US Dollars, which in turn adds upside pressure on commodity prices. Second, money flows into the commodity sector usually accelerate when fears of inflation are rising as commodities is considered as an inflation hedge. A rise in commodity prices then feedbacks into higher inflation. Most of the conditions are here to see a rise in inflation. Moreover, as previously discussed, commodities offer at this same time interesting value in absolute and relative terms. The sector, for which sentiment remains depressed, can now be considered as a cheap hedge against an uptick in inflation.
 |
Main drivers this week
|
Commodities and Economic Highlights
Commentary by Robert Balan, Alessandro Gelli, Marion Megel and Alban De Rougé
WTI prices under pressure
The price of WTI crude oil fell last week close to $91 per barrel, the lowest level since April 2013, due to the recent rise in crude oil inventories in the Midwest and especially at Cushing, Oklahoma, the delivery point of NYMEX WTI futures. Several factors have contributed to the surplus in the region.
Local crude oil production continues to grow at a rapid pace. Last October, crude oil production grew by 272’000 b/d y/y in the Midwest driven by North Dakota (+193’000 b/d y/y) and Oklahoma (61’000 b/d y/y). Moreover, imports of crude oil from Canada rose last year by 134’000 b/d y/y, while local crude demand is at an elevated level, as the refinery utilisation rate averaged 91.1% in 2013 and reached 96.5% in December, driven by strong margins. Limited spare refining capacity implies that incremental crude oil output needs to be moved out of the region.
As the Brent-WTI spread narrowed closer to $10 per barrel at the end of December, it became less economic to move crude oil out of the Midwest to the East and the West Coast.Indeed, the cost to transport crude oil to these two regions by rail from the Midwest is estimated between $9 and $17 per barrel. Lower crude oil transferred hence led to a rise in crude oil inventories in the Midwest, adding downside pressure on WTI.
WTI prices are likely to face further downside pressure. Indeed, the refining maintenance season has started on the US Gulf Coast, home to about half of the US refining capacity. This will be follow at the end of February by refiners on the Midwest. The decline in crude demand in both regions (which are now connected thanks to new pipelines) implies that an important surplus is likely to build in the region, leading to a larger WTI discount to Brent. The wider spread is needed to allow the surplus to be moved out of the Midwest to the East and West Coast, which still imports light sweet crude oil, a similar quality of what is produced in the Midwest and on the US Gulf Coast.
Chinese crude oil imports reached record high levels in December
According to the Chinese customs, crude oil imports reached 6.3 million b/d in December 2013, a record high level and up by 730’000 b/d y/y. This offset the impact of weak imports the previous month due to a pipeline explosion, which halted operations at Qingdao, a major oil port. Some crude shipments intended for November were hence unloaded in December, boosting crude oil imports numbers. Moreover, the scheduled start of two refineries in January (Sinochem’s 240’000 b/d Quanzhou refinery and PetroChina’s 200’000 b/d Sichuan refinery) also contributed to boost foreign purchase of crude oil.
The start of the new refineries and the arrival of delayed tankers were not the only factors behind strong crude oil imports in December. In fact, Chinese crude oil imports have started to grow at a more rapid pace in the second half of 2013 on stronger refining activity. Thus, while Chinese crude oil imports grew by only 250’000 b/d y/y in 2013 on average, it increased by 530’000 b/d y/y in the second half of the year (in H1 2013 Chinese crude oil imports actually fell by 30’000 b/d y/y), in line with improved economic conditions. The surge in Chinese crude oil imports at the end of last year has boosted tankers freight rate. The Baltic Dirty Tanker Index reached in the second half of December 2013 the highest level since 2010 for this time of the year.
Chinese crude oil imports are likely to remain strong in the first part of January in anticipation of the Chinese New Year holiday which starts on January 31st. The latter is likely to lead to lower crude oil imports due to lower industrial activity during these holiday. However, imports are likely to rebound thereafter as refining activity should rebound. Indeed, inventories have fallen sharply in the second half of last year and need to be replenished as the economy is growing at a faster pace.
Zinc’s demand higher than expected in 2013, absorbing inventories
Zinc was the best performer in 2013 due to a strong December rally as fundamentals are tightening. Improving demand is indeed set to absorb some of the accumulated surplus and inventories. According to Wood Mackenzie, global demand was higher than expected in the first ten months of 2013 (on strong automotive and construction sectors in China and in the US) and annual consumption could have grown by 5.9% last year (vs. initial expectations of 4.4%) and could rise by another 6-6.5% in 2014. Supply should also increase, but to a lesser extent, by 2.5% in 2013 and 4% in 2014 – leading to a shrinking surplus.
This year, the ore depletion at important zinc mines, which are set to close between 2014 and 2016, should remain a central theme for zinc, supporting prices. Also, global inventories are declining fast: after having reached a high of 61 days of consumption in March 2013, inventories are now estimated at about 50 days of consumption, the lowest level since 2010. Zinc remains therefore a top pick for 2014 as we expect markets to start pricing the solid long-term forecasts.
Switch from wheat to corn feeding
On the 10th of January, the US Department of Agriculture (USDA) published two highly anticipated reports, the monthly World Agricultural Supply and Demand Estimates (WASDE) report and the quarterly Grain Stocks report. One fact summarises these two reports: Breeders have switched from wheat to corn feeding.
According to the Grain Stocks report, only 10.4 billion bushels of corn were stored in the US on the 1st of December 2013. It means that a total of 4.3 billion bushels were used during the first quarter of the season (September–December), largely above the average trade expectations of 4.1 billion bushels. An answer was provided in the WASDE report. Indeed, for the third consecutive month, the USDA revised upwards the corn consumption forecast by 100 million bushels. Demand will reach a record level of 11’700 million bushels, 13% higher than last season. The rise came from the “Feed and Residual” part, which is expected to reach 5’300 million bushels, the highest level since the season 2007-08 and up by 22% since last year.
At the opposite, the USDA revised lower the wheat consumption forecast by 60 million bushels. The decrease came also from the “Feed and Residual” part, which is expected to reach only 250 million bushels, 20% less than expected in the December report and 36% less than last year. The publication of these data confirms what we said last month: Due to the high spread between wheat and corn prices, breeders have increased the use of corn at the expense of wheat for feeding. Indeed, grains used by growers maximise protein intake and minimise its cost relative to other grains.
In October, a bushel of wheat cost $2.6 more than a bushel of wheat. After the release of these reports, corn prices increased by 5.0% during the day whereas wheat prices lost 2.6%. Therefore the spread has decreased significantly and is now standing at $1.4. The publication of these data confirm what we said last month: Due to the high spread between wheat and corn prices, breeders have increased the use of corn at the expense of wheat for feeding. Indeed, grains used by growers maximise protein intake and minimise its cost relative to other grains. In October, a bushel of wheat cost $2.6 more than a bushel of wheat. After the release of these reports, corn prices increased by 5.0% during the day whereas wheat prices lost 2.6%. Therefore, on the 10th of January, the spread has decreased significantly to reach a level of $1.4.
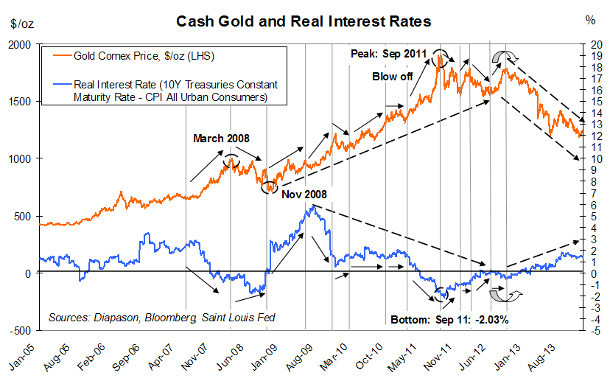
Chart of the week: Gold: it is - almost - all about real rates
|
As the US Fed officially announced the slowdown of its quantitative easing program on December 18 2013, long-term interest rates run up from 2.89% to 3.04% on the last day of the year, the highest level since the summer 2011. In the days following the FOMC meeting, the gold price dropped and ended up the year at $1,201/oz, a decline of 1.44% from the Fed’s announcement. Gold’s poor December performance contrasts with cyclical commodities such as base metals or the energy sector, which mostly improved in the two weeks that followed the tapering confirmation. Afterwards, during the first ten days of January, long rates retreated (to 2.88%) and gold, on the contrary, improved by nearly 4%. This very strong inverse correlation between gold and long rates is nothing new. Since the 1970’s when the gold price was set free, it has moved inversely with the former for most of the time; and more specifically with real interest rates (as the CPI has been low in the past months, inflation has currently a lower impact on real rates but remains an important factor on a long term basis). In particular, since real interest rates have started to decline in mid-2007, the inverse relationship between gold and long rates have been almost indisputable: a movement in the rates has led almost systematically to an opposite dynamic on the gold price. Real interest rate may have made recently a top at 3.0% and could decline until the middle of Q1 as US payrolls may remain under pressure. Gold prices should benefit from this decline. In turn, the rebound in gold prices should confirm that the precious metal sector has made a bottom in December last year. The precious metals sector’ bottom follows sequentially the one made in Energy in April 2013 and in Base Metals in June 2013. This may lead to the outperformance in the short term of the precious metals over the other commodity sectors. |
|
|
For the full version of the Diapason Capital Markets report, please contact info@diapason-cm.com