
December 31, 2013
Elevated oil prices are justified
Commentary by Senior Market Strategist Robert Balan
"Markets are never wrong; opinions are"
Jesse L. Livermore
At the end of 2013, Brent prices returned to the same level than at the beginning of the year close to $111 per barrel, which is also almost similar to the annual average of the previous two years but significantly higher than the ten-year average of $70 per barrel. This elevated price structure can surprise considering the tight oil boom in the US and the slower economic growth in China. However, the market is not wrong. The elevated Brent prices are justified by several factors.
On the supply side, the high cost of marginal fields and supply disruptions supported oil prices these past few years. This year, declining political stability in Libya took about 1 million b/d out of the market this summer, while international sanctions forced Iran to reduce crude oil production. In Nigeria, oil theft contributed to supply disruptions amid important delays for the start of new oil capacity in Iraq, Brazil and Kazakhstan. According to US government, unplanned crude oil production outages averaged 3 million b/d between August and November. Thus, despite the increase in US crude oil supply by around 1 million b/d y/y, Saudi Arabia was forced to increase its output to 10.2 million b/d in August, the highest level since 1981 in order to balance the market.
These past few years, strong demand growth from emerging countries keep the oil supply/demand balance tight. In 2013, global oil demand is set to grow by 1.1 million b/d y/y, a stronger than initially expected demand growth. The International Energy Agency forecasted in April an increase of global oil demand growth of only 0.8 million b/d y/y. Although the Chinese oil demand growth weakened this year, this was mitigated by resilient oil demand growth in other large emerging countries such as India and Brazil. But the most important contributor to the strength in global oil demand growth was the improvements in OECD countries.
Europe, which experienced in 2012 a decline in oil demand by almost 600’000 b/d y/y, is now enjoying a rebound in economic activity, leading to a significantly lower decline in oil demand. This year, the latter should indeed decline by only about 200’000 b/d. US oil demand is on the other hand set to grow annually for the first time since 2010. Oil demand in OECD countries is hence likely to decline by a significantly smaller amount than last year.
The elevated level in oil prices is hence justified by stronger oil demand amid supply disruptions and delays at oil projects. Next year, the rebound in crude oil supply, which is expected (but not certain) is likely to be mitigated by the acceleration of global oil demand growth, allowing Brent prices to remain around these levels.
 |
Main drivers this week
|
Commodities and Economic Highlights
Commentary by Robert Balan, Alessandro Gelli, Marion Megel and Alban De Rougé
Base metals inventories have normalised
LME inventories of copper, tin and zinc have decreased in the second half of 2013 and have approached normal levels – lifting at least partially fears of massive oversupply for the year ahead. Indeed, after having more than doubled from 320,000 tonnes in January 2013 to 666,000 tonnes in June, copper inventories held at the LME retreated by 41% in the second half of the year and finished the year at circa 390,000 tonnes. Similarly, tin inventories dropped by 28% in H2 2013, following an 11% increase in the first six months of the year. The picture for zinc is quite different, as the galvanizing metal dropped all through the year from record high levels hit in late-2012, from 1.2 million tonnes to 914,000 by the end of 2013.
LME inventories do not provide a complete picture of the world’s inventories as most of the material is held at producers and consumers’ facilities (commercial stocks) – but we believe that the daily release of LME inventory levels has a great impact on markets as being the sole immediate and reliable indicator of metals stocks.
Looking at commercial inventories (latest estimate as of early Q4 2013), the situation appears similar. Copper global inventories represent about 26 days of demand, below the 15-year average of 29 days and following a multi-year peak of 32 days hit in early 2013. As for tin, commercial inventories have remained broadly stable in 2013 at about 31 days of demand, below the 15-year average of 40 days. As for zinc, the picture appears very supportive as commercial inventories have rapidly fallen from a 17-year high of 60 days of demand hit in early 2013, to about 45 days as of Q4 2013.
Zinc’s supply-demand picture to improve next year
Last week, the company MMG announced it will close its Century zinc mine in Australia as early as in mid-2015 due to depleting reserves, defying consensus’ expectations that were anticipating the closure for 2016. The mine, which has a capacity of 485,000 tonnes per year, accounts for as much as 4% of global supply, and is symbolic of zinc’s long-term prospects of struggling supply. In the coming 3 years, several zinc mines are set to shut down due to the falling ore grades; while little projects are in the pipeline to counterbalance the production losses.
The metal is heading towards a tighter year 2014 (though still a surplus) as demand is accelerating in China (with strong automotive and construction sectors, the two largest zinc-consuming industries) and as supply is getting tighter. In addition to the aging mines, Chinese smelters are currently delivering extremely tight margins and could be forced to lower production levels.
The improving supply-demand picture has already started to materialise, with lower inventory levels: after having hit a 17-year high in early 2013, commercial and exchange inventories have drastically decreased in the past year, from an equivalent of 60 days of consumption to close the year at about 45 days.
Agriculture: Let’s be optimistic
In average, agricultural commodities declined in 2013 as reflected by the drop of the DCI® Agriculture Total Return Index of 8.8%, leading to investors’ distrust. Two reports highlight this situation.
Firstly, in the COT report published by the CFTC, managed money, a proxy for investors, have a net short position on coffee, corn, sugar and wheat meaning they anticipate lower prices in the near future. For the seventh consecutive week, investors cut their net long position in the main agricultural commodities, matching the longest such streak on records. Secondly, a report made by Census shows that only 30% of analysts are bullish for these same commodities: coffee, corn, sugar and wheat.
However, for few commodities, such as coffee, prices are below the cost of production which usually represents a support to prices as it signals producers to stop supplying. Therefore, we can assume that farmers will take into account the low level of prices in their production decision: crop rotation, use of fertilisers… This will lead to a readjustment of the supply and demand balance and will encourage investors to be more optimistic in 2014.
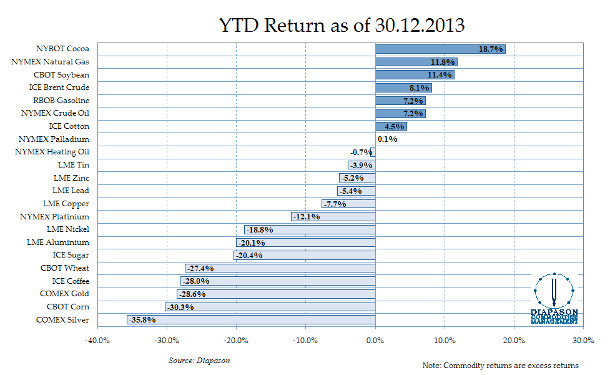
Chart of the week: Commodities in 2013
|
Prices for most energy commodities, cocoa, soybean and cotton moved higher this year. The best performers were NYBOT Cocoa (+18.7%), followed by NYMEX Natural Gas (+11.8%) and CBOT Soybeans (+11.4%). The DCI® Energy Total Return Index was up by 6.6% in 2013. On the other hand, metals and other agriculture commodities’ prices fell. The DCI® Precious Metals Index was down this year by 28.9%, the worst perfoming sector. In the agriculture sector, corn and wheat suffered from a bumper crop globally that boosted inventories significantly, contrasting with last year when a major drought hit the US and reduced sharply grains supply. Cocoa, however, experienced a perfect storm with a combination of stronger demand due to the improved economic situation and poor yields in Ivory Coast. Precious metals suffered from growing expectations of the US Fed tapering throughout the year, from investors’ capitulation on inflation risks, from rising real interest rates in the last quarter of the year, and finally from a firmer US dollar in the second half. Palladium and platinum outperformed the sector on improved economic growth and strong US and Chinese vehicle sales in particular, as well as on renewed supply fears in South Africa. As for base metals, the negative sentiment on China hampered prices for most of the year, before supportive data spurred a rally across the entire sector in late-2013. Tin prices were supported by persisting tight supply-demand fundamentals and concerns regarding Indonesia’s mining rules as reflected by its lead in the sector. On the other hand, energy benefited from the structure of the forward curve as most oil futures were in backwardation, reflecting the tight market conditions. Oil demand indeed grow at a faster than initially expected pace while important supply disruptions occurred. The cold wave that recently hit the US contributed to the strong performance of US natural gas prices as it boosted demand for space-heating and led to well freeze-offs, reducing supplies. It is interesting to note that prices for this year’s weakest commodities are now below or close to production costs. This is typically a strong support for prices. Moreover, even crude oil prices at current level are not far from the marginal cost of production. These factors are implying that commodity prices have room to move higher next year. |
|
|
For the full version of the Diapason Capital Markets report, please contact info@diapason-cm.com