
December 23, 2013
Tapering is on: how will it impact commodities?
Commentary by Senior Market Strategist Robert Balan
"The impacts of decisions like quantitative easing (…) are still washing through markets around the world. But it is a mixed story because, despite the uncertainty, we are also seeing economic recovery"
Rio Tinto’s CEO Sam Walsh, December 2013
The Fed decided last week that it will scale back its multibillion-dollar stimulus program, starting in January by $10 billion per month, as it expressed confidence in the nation’s economic recovery. The feared outcome from tapering has not been realized. Instead, most risk assets rallied after the announcement, with some noticeable exceptions, including precious metals. How will tapering impact the commodity sectors individually? Fundamentally, gold and silver are likely to suffer more in the medium run, while in the longer-term, markets may attach more importance to the solid fundamentals emerging from commodity demand.
There are several factors that should neutralize the impact of tapering on commodities, especially base metals. Global manufacturing confidence is improving, as well as actual output (JPMorgan Manufacturing PMI hit 29-month high). Also, US industrial production rose 1.1% in November, above the consensus (0.6%). Furthermore China’s demand for metals still appears strong, with soaring imports and strong production of metals-consuming products (power grid spending still growing, albeit slower than before, for instance). For base metals as a whole, we may see a turning point for supply-demand fundamentals in 2014: markets such as tin and lead are expected to stay in deficit next year, while surpluses in nickel and zinc are likely to shrink dramatically. Even in copper, the one exception, the surplus next year is likely to be quite modest and lower than initially expected indeed. The key driver of this trend is an acceleration in demand growth that is already under way.
For precious metals, Fed tapering and a general reduction in liquidity are clear headwind for those markets. A reduction in risk aversion had been at least partially priced in following the 27% decline in gold prices since the start of the year. However, these recent events are additional negative factors for the medium term picture not only for gold but also for other precious metals. Nonetheless, after the recent wave of liquidation, gold prices could rebound to the $1400 area in the short run.
In contrast with precious metals, energy and base metals prices moved higher. Base metals prices have recently accelerated and are up by 3.3% since the beginning of December. The Fed’s reduction of its stimulus program by only $10 billion per month may indeed be too small to negatively affect cyclical commodities, which are currently benefiting from the acceleration of global economic growth.
 |
Main drivers this week
|
Commodities and Economic Highlights
Commentary by Robert Balan, Alessandro Gelli, Marion Megel and Alban De Rougé
Will oil supply disruptions continue in 2014?
This year was marked with important supply disruptions which contributed to a significantly tighter oil market. Between January and May 2013, global estimated unplanned crude oil production outages stood at 2.1 million b/d. The latter accelerated in Q3 2013 and reached 3.0 million b/d in August 2013 as Libyan crude oil production dropped sharply.
Indeed, the fall in Libyan crude oil supply was due to strikes and armed groups halting operations at oil terminals and fields. Moreover, international sanctions continued to affect Iranian crude oil exports, while oil theft in Nigeria led to lower crude oil production. In fact, the deterioration of the situation in Libya in September contributed to offset the recovery in supply in China, Sudan, the North Sea and Brazil.
The severe supply disruptions this summer, while demand from refineries reached a new record high level at 78.1 million b/d in July 2013, up 1.8 million b/d y/y, forced Saudi Arabia to boost crude oil production to 10.20 million b/d in July 2013, up 1 million b/d from December 2012 levels. This led to reduced spare producing capacity amid higher geopolitical tensions in the Middle East. Will this scenario repeat next year?
The situation in Libya, Yemen, Syria and Nigeria is unlikely to improve significantly in the short-run, keeping about 2.0 million b/d out of the market. On the other hand, crude oil production in the North Sea, Brazil and China has recently recovered following unplanned outages.
However, following Libya and Nigeria, Iran and Iraq are major contributors to global unplanned crude oil production outages. The situation in Iraq has improved for now. The country remains nonetheless vulnerable to supply disruptions due to the poor infrastructure and the fragile political situation. Moreover, Iranian crude oil production is unlikely to rebound until at least May 2014 when a new nuclear deal need to be concluded, implying that supply disruptions should remain important during at least the first part of next year.
Supply disruptions have been exceptionally high in 2013 and are unlikely to stay at this level. Nevertheless, these supply disruptions will not disappear abruptly. The gradual reduction of supply outages is not large enough to have a negative impact on oil prices as global oil demand growth has recently accelerated. On the other hand, it could have a negative impact on prices when global demand for crude oil weakens seasonally in Q2 during the spring refining maintenance season.
The natural gas rally may not last
Last week, US natural gas prices moved above $4.4 per million Btu, a rise of more than 25% since the beginning of November and the highest level since April 2013. The significant decline in natural gas inventories these past three weeks reflected strong demand due to lower than normal temperatures and the winter storm which hit the US last week. The storm also led to supply disruptions following well freeze-offs in Utah, Wyoming and North Dakota. US natural gas inventories fell in November to the lowest level since 2008, erasing the surplus that arose due to the shale gas boom and the economic recession. These factors have contributed to tighten the US natural gas market, pushing prices significantly higher.
However, other factors suggest that the current rally has fragile foundations. Indeed, the surge in demand was only caused by the sharp rise in space heating demand. On the other hand, natural gas demand from the power sector, which has been falling since December 2012 due to the higher cost of natural gas relative to coal, is likely to drop further in the coming weeks. The recent surge in space heating demand has led to a rise in US coal prices by about 4%, lower than the rise in natural gas prices, making the latter even less competitive with coal. This should encourage further gas-to-coal switching in the coming weeks.
Moreover, dry natural gas production continues to rise due to new infrastructure and relatively high drilling activity in the Marcellus Shale. Output growth in this region is more than offsetting the decline in output in southern shale gas basins such as the Haynesville shale in Texas. The latter saw a decline of 2.2 billion cubic feet per day (bcf/d) y/y between January and November 2013 on average, while growth in the Marcellus Shale averaged 3.7 bcf/d.
Furthermore, US natural gas production growth could accelerated in the coming months encouraged by higher natural gas and natural gas liquids (NGLs) prices. The 50% rise in US propane prices since the beginning of the year should indeed encourage companies to drill for NGLs, leading to stronger output of dry natural gas (methane) which is produced alongside propane. Finally, the ongoing development of tight oil fields also continues to increase associated natural gas production. Thus, stronger supply amid weak demand should prevent natural gas prices to stay above $4.2 for a sustained period.
China’s copper restocking on track despite lower SHFE inventories
The base metals sector has strongly rallied since the beginning of the month, on strong Chinese economic data, which confirm no hard landing in the world’s largest metals consuming country. Zinc has gained 6% MTD, lead 4.4%, nickel 4% and copper 3.2% for instance. This rally was mostly driven by an improved sentiment, as indicators have been indicating strong Chinese demand since the summer 2013.
China’s copper demand, in particular, has continued to hold firm. The inventory rebuilding cycle — which started in July this year when domestic stocks hit their lowest level since late-2011— is still on track, pushing China’s imports of copper higher. In the past weeks, this restocking cycle has been questioned as copper held in SHFE facilities has been declining, prompting several analysts to forecast lower imports in the coming months. We believe this reasoning is biased as SHFE inventories do not provide a full picture of the country’s inventory levels; and that material held in bonded warehouses must be taken into account. According to Metal Bulletin, bonded warehouses stocks have been steadily rising since August this year to total 560,000 tonnes last week. Total domestic inventories (SHFE + bonded) are thus about to show their fifth consecutive months of increase, confirming the restocking activity.
However, the pace of restocking is relatively slow, when compared to the level of net imports and production. November copper imports were again on the rise, to 435,613 tonnes, up 19% y/y. Although the level of refined copper imports is not disclosed yet, we assume it could have risen by a double-digit figure too. Production rose 2.6% m/m in November 2013 to a third straight monthly record. With inventories rising slowly, China’s apparent demand (net imports + production—change in inventories) probably remained near record high in November.
Silver investment demand declining further
As gold has underperformed in the past weeks (-4.5% since the start of December), so has silver (-4.2%), on a continuing decline in investment demand. The Fed’s announcement to reduce its asset-purchase program by $10bn each month has dragged prices further down last week. The interest rates have also continued to increase, affecting precious metals: the 10-year Treasury rate rose from 2.53% at the end of October to 2.89% on December 18. The quick rebound in the US dollar (DXY) following the Fed’s conference also weighed on precious metals.
This is particularly worrisome for silver, as the drop in investment demand is relatively new, after having resisted pretty well since the mid-April sell off. On the Comex, the first week of December showed tumbling net long speculative positions for gold (to 48,500 lots, the lowest since July this year) and for silver (to 4,300, the lowest since June 2013). Although non-commercial long positions have rebounded the following week, they remained at relatively low levels.
Holdings of gold and silver ETFs have continued to head downwards. The rate of gold outflows from the world’s ETFs has accelerated again since late-November, at a pace of circa 0.7%-1% per week (7-day percentage change), following a period a decelerating outflows (of circa 0.3%-0.5% 7-day change on average), from October 23 to November 20.
Silver ETFs holdings peaked in October 2013 and have dropped since then, marking the investors’ lassitude for the devil’s metals given its poor performance. Outflows have accelerated to the rate of 0.7-0.8% per week these past days, compared with 0.08-0.5% in the period from mid-November to December 10, 2013. This also follows a period of inflows from July to mid-October 2013.
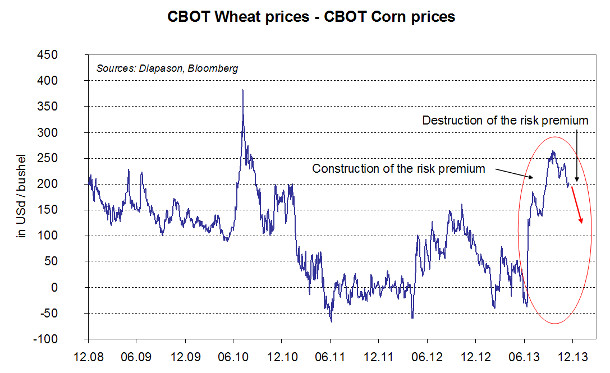
Chart of the week: The Wheat – Corn spread to narrow in Q1 2014
|
The CBOT wheat - corn spread is currently trading near its widest level since August 2010. However, during the first quarter of 2014, the spread should narrow for different reasons. Firstly, if we look at seasonality, for the last 6 years, the price of corn outperformed that of wheat by 10% in average during the first quarter of the year. Indeed, winter is one of the riskiest periods for wheat development as frost can decimate crops if ears are not developed enough. Therefore, during autumn a risk premium is building as uncertainty concerning the production is at the maximum. This usually causes an increase of wheat prices versus corn prices. And during the first months of the year, analysts can estimate the damages on wheat due to winter and generate more precise forecasts of the next harvest leading to the destruction of this risk premium and the under-performance of the wheat. Secondly, breeders will take advantage of this high spread. Grains used by growers maximise protein intake and minimise its cost relative to other grains. Therefore they will increase the use of corn at the expense of wheat for feeding. This prospect of a rebound in demand is also offering support to corn prices. The opposite happened last year, when corn and wheat traded at parity in several areas of the US. Breeders were encouraged to use wheat, richer in protein, instead of corn in livestock rations. Thirdly, managed money, a proxy for investors, cut their net short position on corn by more than 86’000 contracts to 92’216 lots, in the last month according to data published by the CFTC, meaning they anticipate a price increase. At the opposite, they raised their net short position on wheat by 50’000 contracts to 69’461 lots. This level represents the biggest bet on price falls since records began in 2006. Therefore, taking into account these three reasons, we can conclude that there is a strong probability to see the wheat-corn spread narrowing during the first quarter of 2014.
|
|
|
For the full version of the Diapason Capital Markets report, please contact info@diapason-cm.com