
November 25, 2013
Weakening housing market may discourage the US Fed from tapering
Commentary by Senior Market Strategist Robert Balan
«The U.S. housing market is in trouble, and it’s foolish to believe that it’s going to show gains like it did earlier this year and in 2012. More and more evidence is lining up in favor of the housing market in the U.S. economy seeing stagnant growth, or maybe even heading for a downturn. »
Mohammad Zulfiqar, November 22th 2013
US Existing Home sales fell 3.2% m/m in October to 5.12mn after a September rate of 5.29mn, weaker than the consensus (5.14mn), to a rate that is the weakest in 4 months. We are afraid that this is just the start of a housing debacle which comes as a consequence of the run-up in mortgage rates in Q1 and Q2 2013. A serious break in house sales and prices would be a big setback for the Fed's desire to normalize policy. There is no doubt that the health of the housing market is comparable to unemployment in the Fed calculus of macro importance. At the early stage of the recovery from the Great Recession (GR) it was easy to understand how more people working leads to a growing housing market. But an inflection point was reached probably in late 2011, and so the causality has gone the other way -- the housing recovery, if it falters, will severely impact future US employment prospects.
Several industry segments closely allied or related to the housing sector have experienced encouraging job growth over the last 12 to 18 months as home prices and sales rose, following improvements in the general economy. Gains during the period to jobs in construction and mortgage banking to home furnishing stores have been fairly robust — Recruiter.com reported that over 187,000 construction jobs have been created during that period, and that the construction industry now employs approximately 7.8 million workers. The company also reported that industries outside of construction have also seen steady job growth. Housing supply chain jobs were found to have increased by 3% (over 59,000 jobs) since 2011, with the industry now employing over 1.75 million workers.
The US and World Report newspaper reported that home building alone was responsible for 20% of GDP growth in the last six quarters. The importance of the housing segment goes beyond those numbers, as there is a significant amount of other housing-related employment, whether connected to building, furnishing a house, or other housing needs like leasing, property management and the lumber industry.
An impending break in homes sales and prices could therefore cloud near-term employment prospects, and hence could influence the Fed's timetable for its expressed desire to taper its securities purchases being carried out under the QE3 program. In the Fed's priors, we also believe that there is a great deal of importance attached to the health of the housing market — probably as much weight as it attaches to unemployment, or probably more. Housing-related job-creation has been one of the bright spots in the employment spectrum and so it would make things even more complicated for the Fed, if that segment goes away. We believe that if the housing market breaks lower further, the Fed will likely put any tapering plans on hold, favoring risk assets including commodities.
 |
Main drivers this week
|
Commodities and Economic Highlights
Commentary by Robert Balan, Alessandro Gelli, Marion Megel and Alban De Rougé
Iranian crude oil exports will not rebound after the nuclear deal
On Sunday morning, Iran and the P5+1 countries (the permanent members of the UN Security Council and Germany) finally concluded an interim agreement to curb Iran’s nuclear program. The deal was followed by an important decline in oil prices as it reduced significantly the geopolitical risk premium. Nonetheless, the agreement is widely criticized by both hawkish factions. At the US Congress, Republicans and some Democrats have threatened to enact new punitive sanctions on Iran, which could kill the Geneva agreement.
Moreover, if the nuclear deal manages to survive the stiff oppositions from both sides, Iranian crude oil exports are not expected to rebound. Indeed, the agreement only stipulates that the Western powers will “pause efforts to further reduce Iran’s crude sales, enabling Iran’s current customers to purchase their current average amounts of crude oil”. This implies that Iranian crude oil exports are likely to stay at current levels of around 1.2 million b/d and will remove the need for Asian customers to reduce their shipments of Iranian crude cargoes by year-end, which was required for the renewal of the US waiver on Iranian crude oil imports.
Furthermore, even if a new deal allows Iran to increase crude oil exports, Iranian crude oil production would increase back to pre-sanctions levels only at a slow pace. Indeed, contrasting with Libya, Iran produces heavy crude oil, which does not flow easily. The lack of investment these past two years at idle oil fields suggest that it could take several months for Iran to increase output back to pre-sanctions levels (5-6 months according to industry sources). The growth in output would be especially difficult during the winter when natural gas supply, which is injected to boost oil flows, is scarce as it is also used as a heating fuel.
China’s apparent copper demand at record high
Base metals prices retreated in mid-November, on renewed fears over the Chinese economy and uncertainties regarding the US Fed’s tapering agenda. However, indicators of metals demand have remained strong. Janet Yellen highlighted the fragile employment level in the US to support the quantitative easing program of the Fed. Also, the Chinese plenum has sent some positive signals for base metals: the plan to liberalise further the Chinese currency system could allow an appreciation of the Yuan, making metals imports more affordable. The liberalisation of the urban migration movements could also spur another round of infrastructure development. Finally, a stricter environmental policy could affect the production of aluminium, which consumes 6% of China’s electricity production.
The latest economic data also suggest a strong demand currently in China, especially for copper. In particular, the preliminary trade data for the month of October showed strong metals import levels, despite the Golden Week holidays, which usually cause a seasonal lull. Total copper imports fell by 11.2% m/m to 407,000 tonnes last month, but remained though 26% above October 2012 levels. This included 292,620 tonnes of refined copper, up 27% y/y. The copper restocking cycle is on track, supporting demand for overseas’ copper.
Also, production hit a record high in October, at 637,958 tonnes, exceeding the previous record set in the previous month. Inventories have continued to rise due to the restocking process, but at a relatively slow pace compared to the rise in production and imports. Consequently, China’s apparent demand (production + net imports – estimated change in inventories, including bonded warehouses) was up +30% y/y in October at about 915,977 tonnes, the second highest level ever just slightly below the record high set in September of 956,659 tonnes. This volume is particularly impressive considering the seasonal lull that China usually experiences in October.
Gold still looking for direction
Gold has remained below the $1,300/oz level this week, still moving according to the consensus’ expectations regarding the US Fed’s tapering plans. Although Janet Yellen highlighted the fragile employment level in the US to support the Fed’s QE, markets have continued to fear a slowdown in the asset purchase program as early as the beginning of 2014.
In addition, gold has also been affected by recent movements in long real interest rates and in the US dollar. The 10-year rates have indeed slightly rebounded through November, from 2.53% at the end of October to circa 2.7% in mid-November. Although this increase appears marginal, it has nevertheless contributed to drag the yellow metal back to a four-month low. Also, gold has continued to be hampered by a firm US dollar. After having appreciated to 81.3 (DXY) in early November, the US dollar has fallen again from there, but only to 80.3 as of November 19. The depreciation appears too slow to support gold.
As far as the sentiment is concerned, the bullish consensus was 55% positive on gold during the first week of November, from a low at 25% in June this year, the lowest since May 2004. This was also a decline from 63% at the beginning of November.
Although speculative activity appeared on the rise at the start of the month, the past week has witnessed another decline in net longs. On the Comex, the net long speculative positions dropped back below 100,000 lots (futures and options), following three consecutive weeks of net long positions above that level. Net long specs have only exceeded 100,000 lots on nine occasions since gold’s massive sell-off in April.
However, we have noticed some improvements in ETF demand. Outflows from the world’s gold ETFs have continued, but at a much slower pace. Holdings are now decreasing at a pace of just 0.4% weekly, compared to a pace of +1% in early October and 1.5%-2.5% during the summer. We expect ETF outflows to slowdown significantly in the coming weeks and moderate inflows to restart by the end of the year.
Corn prices impacted by the new RFS mandate proposal
The US Environmental Protection Agency (EPA) released, last Friday, a proposal to modify the Renewable Fuel Standards (RFS) mandate as level of ethanol in gasoline, specified in a 2007 law, is difficult to meet. The EPA is trying to fix a problem called the “blend wall”, which occurs when the requirement mandated by Congress exceeds the amount of ethanol that can be mixed into gasoline.
Refiners are asked, for the season 2014, to blend a minimum of 15.2 billon gallons of renewable fuel into US gasoline supplies. This level represents a decrease of 16% relative to the previous target, set in 2007. Those volumes suggests a range between 12.7 billion and 13.2 billion gallons of ethanol in US gasoline supplies.
This is the first setback for ethanol, which was seen as a way for the US to reduce dependence on imported oil. For the last three years, the proportion of corn used to produce ethanol in the US was the largest one, averaging 4.9 billion bushels, before feeding with only 4.5 billion bushels. However, the surge in oil production, mainly coming from shale oil and the escalation of corn prices last year due to the worst drought in 50 years has reduced the appeal of ethanol. Moreover, while biofuels lobby has argued that its product was a green alternative to emissions from oil, scientific evidences are showing that producing ethanol consumes so much fertilizer and energy, that the impact on air quality is at best neutral and on water quality may be negative.
Therefore, if we use a target of 13 billion gallons of ethanol, refiners should consume 4.65 billion bushels of corn. In the November WASDE report, USDA forecasted corn use for ethanol at 4.9 billion bushels, 250 million bushels more than our calculations. If we use our quantity, making no other change in consumption, ending stocks could reach 2.1 billion bushels, 2.5 times larger than last season. It will represent the highest level since the season 1987-88, therefore pressuring again corn prices. However, there is a 60 days of public comment following publication in the US Federal Register, before a decision is made and ethanol makers and politicians in corn-producing states such as Iowa lobby hard against easing the ethanol requirement.
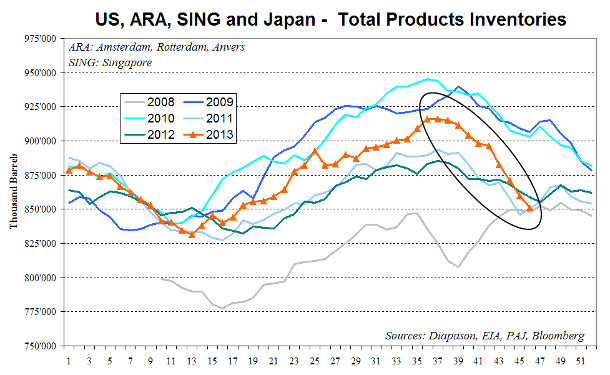
Chart of the week: Weak refining activity in Europe should boost crack spreads
|
The refining maintenance season has ended and refineries are now restarting activity. In Japan, crude runs rose from 3.0 million b/d in mid-October 2013 to 3.5 million b/d last week. In the US, it grew by 600’000 b/d to 15.4 million b/d during the same period. In Emerging countries, refining activity is also increasing seasonally. This contrasts with Europe, where refining activity hasn’t rebound due to extremely weak margins. The International Energy Agency recently revised lower its forecast of global refining runs in Q4 2013 by 600’000 b/d due to weak European crude runs. Weak refining activity in Europe is likely to lead to a lower than usual rebound in petroleum products supply. Europe remains an important refining hub as it accounts for 17% of global petroleum products output. Moreover, this is occurring while demand for petroleum products have significantly improved as reflected into the latest data. In Europe, oil demand in the 15th largest countries rose annually in September for the third consecutive month for the first time since 2010. In the US, oil demand is set to grow annually for the first time since 2010. Oil demand growth remains strong in Emerging Countries, as Indian oil demand recently rebounded and Brazilian oil demand growth is resilient despite the slow down in economic activity. These clear numbers are contrasting with China which sent mixed signals these past two months. The strength in oil demand was recently reflected by the more important than usual decline in petroleum products inventories in major hubs these past few weeks (see above chart). Moreover, oil demand seasonally increases in November and December due to stronger heating demand in the northern hemisphere, the end of the monsoon in the south east Asia and the start of the driving season in the southern hemisphere. Growing oil demand while refining activity will increase by a lower than usual amount and relatively low inventories should contribute to boost crack spreads. Gasoline crack spreads which remained at lower than usual level have a more important upside potential than distillate crack spreads. |
|
|
For the full version of the Diapason Capital Markets report, please contact info@diapason-cm.com