
November 18, 2013
Deflation/disinflation: next global crisis?
Commentary by Senior Market Strategist Robert Balan
«I’ll put my cards on the table right away. I think the predominant risk is that inflation will be too low, not too high, over the next several years. (…) The vigorous policy actions of the Fed and other central banks, combined with sizable fiscal stimulus here and abroad, have sent a clear message that deflation won’t be tolerated. »
Janet Yellen, at the Commonwealth Club of California, June 30, 2009
The central banks ignited asset rallies but are failing the steam deflation.
Despite media reports of "green shoots" appearing in global growth data, the spoiler has been the inability of the developed economies to shake off disinflation and even the risk of outright deflation. It appears that deflation/disinflation is shaping up to be the next, new crisis that the central banks have to deal with. Bloomberg reports that global inflation will be about 2.8% this year, the second lowest since World War II.
Stories of "green shoots" in the global economy may have been prompted by the apparent success of the central banks in pushing up equity prices and home valuations, but it is also clear that they are failing to prevent inflation from falling short of their targets. So like it or not, the 'Big Five” central banks will remain active in the deflation-fighting effort for some time to come.
Falling cost of goods and food may be good news for consumers, but in the aggregate economy, disinflation actually increases the burden of borrowers in paying off debts and can negatively impacts the ability of businesses to boost profits. The bigger risk is if disinflation turns into deflation, which leads households to delay purchases in anticipation of even lower prices and companies to postpone investment and hiring as demand for their products dries up.
Despite the market's focus on the Fed's prospective tapering of QE3 securities purchases, the fact is the Fed continues to operate monetary policy aggressively and may not be finished yet. While US real GDP rose an annualized 2.8% q/q in Q3 2013, much of the gain reflected inventory accumulation and net exports. The recovery in the current cycle remains actually sub-par relative to growth during the past 9 recoveries. The October employment survey struck a cautiously optimistic tone, with a 204k gains in payrolls, but the recovery in the level of payrolls in the current cycle remains notably weaker than that following the early 1970s and 1980s recessions (but stronger than the early 2000s). Layoffs have fallen at a rate on a par with previous cycles, evident in the trend in jobless claims, but the rate of hiring has remained relatively weak.
With inflation not a threat, we expect Fed Chair-presumptive Janet Yellen to couple the current trend towards disinflation and the unsatisfactory progress in reducing unemployment as rationale for prolonging easy monetary policy -- and by implications, postponing any tapering of QE3 purchases which the market now expects to happen in March at the earliest. This should remain a comfort and encouragement for the market to remain invested in riskier assets, including commodities.
 |
Main drivers this week
|
Commodities and Economic Highlights
Commentary by Robert Balan, Alessandro Gelli, Marion Megel and Alban De Rougé
Crude oil bottleneck persists in Canada
While the relation between WTI and Brent is carefully monitored by the market, the spread between WTI and Canadian crude oil has moved a lot recently. The discount of Western Canadian Select (WCS), a heavy sour crude oil benchmark for Alberta, has moved to around $40 to WTI, the widest spread since January 2013. While part of the spread represents the difference in quality between the two grades (heavy sour crude oil grades have typically a $5-$16 discount to light sweet crude oil in this region), the remaining part of the spread typically reflects the marginal cost of transportation, which can vary widely depending on the pipeline capacity, supply disruptions or outages at refineries.
The wide spread between WTI and WCS was caused by the combination of limited pipeline capacity and unplanned refinery outages. Enbridge had to ration space on pipelines between Canada and the US, implying that Canadian producers were not able to ship as much crude oil as needed, and there are very little alternatives than the US market for Canadian producers.
Moreover, demand from Canadian crude oil in the US Midwest fell due to the fire at Citgo 175’000 b/d Lemont refinery in Illinois, forcing Canadian crude to look for other and more distant outlets. This came on top of reduced unplanned outages at refineries in Alberta. Reduced demand and limited availability to move the oil out of Alberta have hence contributed to the wider WCS-WTI spread, in order to allow more expensive form of transportations to coastal regions.
This should not last due to the restart of refineries not only in Canada but also in the US. Nonetheless, until then Canadian crude oil producers will continue to sell their output below cost of production. Weak profitability at Canadian projects could discourage new investment and led to a slow down in crude oil production growth next year.
Failure to renew waivers on Iranian crude imports could boost prices
Last weekend an interim agreement on the Iranian nuclear programme failed to be reached in Geneva between Iran and the P5+1 countries (the five permanent members of the UN Security Council and Germany). Negotiations are expected to resume by November 20. These developments are particularly important for the oil market as an agreement could result in a partial or complete lift of international sanctions against Iranian crude oil exports. Indeed, the international sanctions have contributed since 2011 to the drop in Iranian crude oil production of more than 1 million b/d. This was one of the factors which contributed to mitigate the impact of the tight oil boom in the US.
These negotiations are occurring in a timely manner since most of Iran’s remaining Asian customers are about to see their waiver on Iranian crude oil imports ending. Indeed, the US imposed sanctions on countries which are importing Iranian crude oil, but it gave 6-month waivers as long as Iranian crude oil imports were declining. India, China, Japan and other Iran’s customers have managed so far to reduce Iranian crude oil imports in order to comply with the US sanctions and received exemptions these past 2 years. This has forced Iran to halt crude oil production due to lower crude exports. The US is expected to review this month whether to extend or not waivers to Asian countries, encouraging them to reduce Iranian crude oil imports, which in turn could force Iran to decrease its production of crude oil. This is why the Iranians may be more willing to quickly conclude an interim deal with the P5+1 countries.
Contrasting with India, which already reduced sharply its imports of Iranian crude oil this year, China, Japan and South Korea would need to cut their imports by a combined 410’000 b/d in October and November from September 2013’s level in order to meet targets to comply with the US sanctions. This implies that these countries would need to look for other sources of crude oil, adding upside pressure on international oil prices.
Zinc global inventories are finally heading downwards as fundamentals are tightening
Markets have been waiting for zinc to shine for several years. The metals’ long term prospects indeed appear remarkable, as resource depletion should prompt many producers to shut down mines. Global production could therefore decrease by more than 2% from 2013 to 2015, while global demand should keep rising, by 4% to 5% in the next two years, due to the ongoing urbanization wave in China. Yet, these deficits are a long time coming, as China’s production has been on the rise this year and as inventories hit multi-year high levels in Q1 2013.
However, recent indicators point towards a slightly tighter global zinc market. On the demand side, China’s economic revival has breathed life into the country’s construction and automotive industries. China’s galvanised steel production already hit a record high in the second quarter of the year, exceeding 13M tonnes, up 8% y/y, bringing the world production to an unprecedented volume of 31Mt during the same quarter.
On the supply side, producers are facing strong margin pressure as prices have traded near the marginal cost of production in the past two years. The two largest Chinese zinc smelters, Zhuzhou Smelter and Huludao, both reported heavy losses last year of respectively 619M RMB and 3.7bn RMB (prompting Huludao to suspend trading in May 2013). Consequently, even though production is rising in China, we have noticed a deceleration in incremental mine production. Supporting this case, treatment and refining charges have been flat this year in China, meaning that despite the growing production, smelters do not currently have a strong pricing power when negotiating with miners.
WConsequently, inventories have headed downwards this year. Commercial and exchange inventories globally have decreased from a high of almost 61 days of consumption in March 2013 to 47 days in September. Given the relatively stable stocks at the LME, we do not expect this trend to have reversed since September.
The latest USDA report shows better-than-expected corn and soybean demand
In our last release of the Commodities Insight Weekly, we reported that corn and soybean export sales had been larger than expected and concluded that the USDA should revise upwards its export estimates. And this is what the USDA did last week.
This is a supportive factor for corn and, to a lesser extent, for soybean. Corn’s performance has been lacklustre in the past weeks, hampered by expectations of high global inventories, confirming the end of the era of critically low supplies that followed last year’s drought.
This month however, the USDA statistics provided some slight support to corn prices. Although the agriculture agency increased the yield forecast, consumption and trade estimates in the US were better than expected. Therefore, although inventories are still expected at multi-year highs, they have been revised far below analysts’ estimates.
The yield forecast for corn rose by 5.1 bushels per acre (b/a) to 160.4 b/a. The new estimate points to a record crop of 14 billion bushels, 146 million larger than the September forecast. However, the consumption and exports estimates were also revised higher by 275 million bushels. Therefore, ending stocks are projected at only 1’887 billion bushels, which is an eight year high but largely below the consensus.
The report also provided some fundamental support to soybean, although to a lesser extent. True, the yield forecast was increased by 1.8 b/a to 43 b/a, and the 2013 harvest size is now estimated at 3’258 billion bushels, 109 million larger than the September forecast. On the other hand, however, consumption and exports estimates were also revised higher by 110 million bushels, reflecting the large export sales already made. Ending stocks are though still projected at 170 million bushels, 20 million bushels larger than the last forecast.
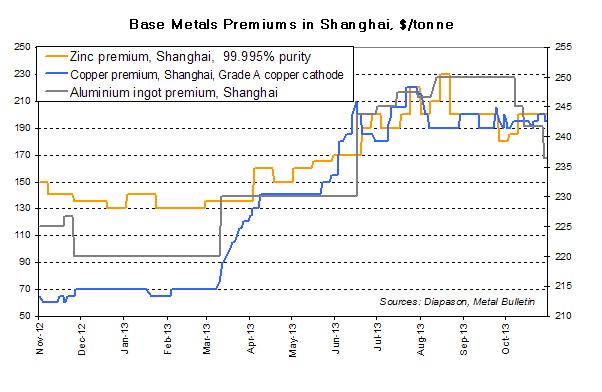
Chart of the week: High imports and premiums suggest firm metals demand in China
|
Base metals prices retreated at the end of last week, on renewed fears over the Chinese economy. On November 13th, copper prices fell below the $7,000/tonne level, the lowest level in three months. However, indicators of metals demand have remained strong. China’s preliminary commodities data for the month of October showed strong metals import levels, despite the Golden week holidays. Total copper imports fell by 11.2% m/m to 407,000 tonnes last month, but remained though 26.4% above October 2012 levels. The copper rebuilding cycle is on track, supporting demand for overseas’ copper. Assuming that production remained stable in October, China’s apparent demand (production + net imports – change in inventories) of copper may be 40% above last years’ levels. At the same time, inventories are only rising slowly, suggesting there is some real, underlying demand also driving imports higher. In addition, base metals consumer’s premiums have remained elevated in China these past weeks. Premiums represent the amount that consumers are willing to pay on top of the benchmarks to secure their metal purchases. The higher the premiums, the tighter the domestic market is. Although aluminium premiums have retreated this month, from $250/t to $237/t, zinc and copper premiums are holding firm and have hovered in a range between $180/t and $230/t since the beginning of the summer. |
|
|
For the full version of the Diapason Capital Markets report, please contact info@diapason-cm.com