
November 11, 2013
Chinese liberalization of the RMB would benefit commodities
Commentary by Senior Market Strategist Robert Balan
«We think (we) can allow market supply and demand to gradually bring about a greater effect on the exchange rate float.»
Zhou Xiaochuan, PBoC's governor
Significant Chinese reforms are expected to be unveiled at the Third Plenary session of the Chinese Communist Party. One of the major reforms that could be implemented are measures toward a liberalized interest rate regime and a less controlled, and possibly a free-floating and fully convertible currency.
The effects of China's interest rate and currency reforms on the economy are complex. But the most immediate impact of a free-floating and fully convertible RMB will be even higher inflows of foreign capital and reduction of China's trade surplus (mollifying its large trading partners).
The implications would be an appreciation of the reminbi (RMB) since it is still undervalued (by most Purchasing Power Parity measures) despite the fact that it rose to a 20-year high into late October — it has appreciated 2.5% so far this year, and 34% in the past 8 years. An artificially depreciated currency had enabled China to become the “factory of the world” and to accumulate a gargantuan foreign-exchange reserves ($3.04 trillion). But it came at a cost — the episodic outbreaks of high food and goods inflation and asset bubbles (especially in real estate) bear witness to the difficulties of the central bank in conducting monetary policy constricted by a pegged, low-value currency.
China will benefit from a stronger currency; for one it will help rebalance the economy from infrastructure to domestic consumption by providing its citizens more purchasing power for imported goods, (primarily food) thereby helping tame its food inflation issues. It will also help China transition from an era during which the foreign exchange rate drove monetary policy to one where monetary policy drives the FX rates. The PBoC will finally be able to lower real interest rates and embark again on credit expansion (which will ameliorate the impact of the RMB revaluation on industries), without triggering runaway inflation.
The liberalization of the RMB will impact positively commodity prices through two factors. First, this will add downside pressure on the US dollar as Chinese need of US debts (in order to peg the RMB to the US dollars) would drop significantly, although Chinese will likely continue to invest in the US and in Europe. Secondly, the strength of the RMB will increase China’s purchasing power for foreign goods. This should have a positive impact on commodity demand, especially for some base metals whose inventories are low in China.
 |
Main drivers this week
|
Commodities and Economic Highlights
Commentary by Robert Balan, Alessandro Gelli, Marion Megel and Alban De Rougé
US oil demand is set to grow for the first time since 2010
The United-States remain by far the largest consumer of petroleum worldwide, accounting for almost 20% of global oil use and its oil consumption is about 80% higher than in China, which is the world’s second largest oil consumer. Nonetheless, US oil demand has declined since 2005 due to improving vehicle fleet, higher petroleum prices at the pump, the economic recession in 2008-2009 and weak economic growth these past two years. The two latter had a particularly important impact over the recent years, when US oil demand dropped by 1.9 million b/d in 2008 and 2009 (recessionary environment) and by 600’000 b/d in 2011 and 2012 (weak economic growth).
This year, the improved economic situation has allowed US oil demand to rise for the first time on an annual basis since 2010. The US Energy Information Administration data showed that US oil demand grew by 165’000 b/d y/y between January and August 2013, a big difference with last year when it was falling by more than 345’000 b/d y/y over the first eight months.
However, the increase in US oil demand during the first quarter and in April 2013 was driven by weather related issues. It is only by the beginning of the summer that stronger economic growth started to have a positive impact on oil demand growth as reflected by the gradual recovery in demand for petroleum products such as diesel, which is driven by the economic activity during this period.
Moreover, the increase in light trucks sales (+10.2% y/y in Q3 2013) and the stronger travelling activity in the US, driven by low gasoline prices and an improved economic situation, are contributing to higher demand for transportation fuel and particularly gasoline. Additionally, as the US economy continues to accelerate, this should contribute to support oil demand from the industrial sector. US petroleum products demand could therefore start growing at a more rapid pace in the coming months.
Gold demand remains lacklustre in India during festivals
Gold’s investment demand is expected to improve. Despite the fact that, last week, the US Fed cast doubts on its tapering plans, there is more and more economic evidence suggesting that the reduction in asset purchases will only be a 2014-story. Two weeks ago, the plunging US pending home sales provided further reasons not to expect a tapering in the near term. The declining real long term interest rates, along with a weakening US dollar, also offer a much more promising outlook for gold in the medium term.
On the other hand, physical demand is currently struggling, especially in India. The fall of the rupee, which has decreased by 13% against the dollar in the past year, has pushed domestic gold prices higher, affecting the Indian population’s purchasing power. Also, the government’s attempts to curb the trade deficit are finally working. In addition to the higher import duties, gold importers must also now re-export 20% of every shipment. Consequently, the country’s imports of gold are collapsing to record lows, around 7 tonnes per month, well below the 70 tonnes imported during the same period last year. At the Diwali festival on November 3, usually the peak season for gold purchases in India, reports suggested subdued demand, with sales 40% below levels in the same period last year.
We however expect physical gold demand to improve a bit, as the monsoon as been good this year, promising better revenues to farmers, who make up to 70% of India’s gold demand. The Diwali festival will also be followed by other festivals and by the wedding season. In addition, China’s gold imports have remained strong since prices started to fell this year: they hit a record high in March 2013 and have been kept above 100t per month since then, even during the month of September, when imports retreated a bit.
China’s NPI production costs could rise next year, supporting nickel
Nickel is the unloved metal. It has been traders’ favourite short play in nearly three years, as its LME 3-month price remains 50% below the February 2011-levels, compared with performances across the other LME base metals of -25% on average. Nickel has indeed been in surplus during six of the past seven years, but its poor fundamentals are now fully priced and integrated by the market. Therefore, the metal used in the making of stainless steel could be poised for a rebound, as the supply growth could come out below expectations next year.
Nickel pig iron is a low grade ferronickel material, developed by Chinese steelmakers as a cheaper alternative for refined nickel in the production of stainless steel. Producers are currently able to process NPI for a cost of about $18,000-19,000/t. This does not seem particularly cheap today compared with refined nickel prices, but this cost provided Chinese steelmakers with a huge competitive advantage a few years back, when LME nickel prices exceeded $51,000/t in 2007.
The NPI production growth has been impressive: from virtually zero in 2005, the output should exceed 400,000 tonnes this year, up 30% from 2012 levels. Over the past years, there has been a close relation between refined nickel (LME) prices and NPI production costs: as NPI costs decrease, it becomes more competitive as opposed to refined nickel, encouraging consumers to favour NPI over refined nickel. This was particularly the case from 2005 to 2008, and then from 2010 to the end of 2011, when refined nickel prices exceeded NPI production costs. This year, NPI producers have been able to reduce production costs, from more than 25,000/t in 2012 to circa $18,700/t, as a result of improving technology, subsidised energy prices and the growing production from electric furnaces, which usually achieve better costs than blast furnaces. However, NPI’s competitiveness has been hampered by low refined nickel prices, which remain below NPI production costs.
We believe that the probable Indonesian restrictions on mineral ore exports starting in January 2014, either in the form of a ban or higher taxes, will increase the importing costs for Chinese NPI producers, and will reduce NPI’s competitive advantage to refined nickel. This will likely take some time as China has rebuilt its nickel ores inventories ahead of the expected restrictions, but, considering the depressed 3-y performance of nickel compared to other base metals, the slightest support on the supply side could be very positive to refined nickel.
Strong progress of corn and soybean export sales
According to the November WASDE report, the US Department of Agriculture (USDA) estimates corn and soybean exports at 36 million tonnes (Mt) and 39 Mt respectively. Since September 1, beginning of the marketing year, corn and soybean export sales have been larger than expected. In only 8 weeks, the US sold 8.8 Mt of corn and 10.8 Mt of soybean, representing, each time, about 25% of the USDA forecast. If we use a linear trend, the US should have only sold 4.8 Mt of corn and 5.7 Mt of soybean, representing 15% of the USDA estimates (8 weeks divided by 52 weeks).
Moreover, if we add the sales, for the season 2013-14, made before September 1, we obtain a result of 20.5 Mt of US corn either exported or committed for sale, representing 60% of the total expected for the whole season. For soybean, the total shipped or on order for this season reach 32.2 Mt or 83% of the total expected for the full season. These large amounts express the attractiveness of the US. For example, during the week ending the 19th of September, the US sold 2.8 Mt of soybean, the highest level since February 2012 when Chinese President Xi Jinping visited the US with a trade delegation.
Furthermore, after the US government shutdown, which lasted 3 weeks, the USDA published net export sales of 4.7 Mt during this period, or 12% of the US exports estimates. For corn, the sale was even larger with 5.3 Mt or 15% of the forecast. China was one of the big buyer, enjoying the Government shutdown. Indeed, U.S. exporters are required to alert the USDA of any trade deals totalling more than 100,000 tonnes, which the government then reports to the market. Such publications provoke a price response in the markets concerned, as traders saw if their own expectations on trade activity are either confirmed or denied. Therefore, China was able to purchase corn and soybean in large quantities without being noticed by investors as no report was published during the US government shutdown. Each year, China, imports more and more corn and soybeans for its domestic use. Therefore, it is very likely that China will maintain its recent import pace and we can assume that, in the next few months, the USDA will revised upwards its corn and soybean export estimates.
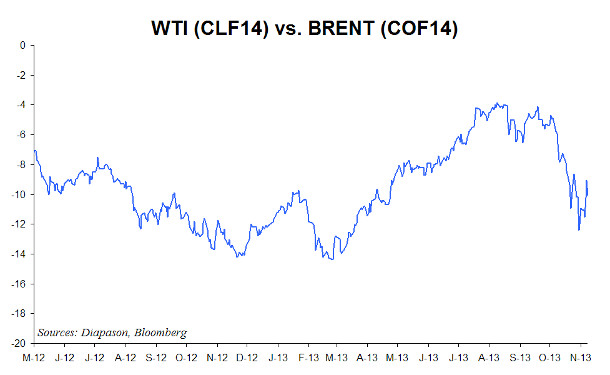
Chart of the week:The Brent-WTI spread is about to narrow significantly
|
On top of the improved pipeline network, strong refining activity in the US Midwest during the summer contributed to the sharp decline in crude oil inventories in the Midwest, bringing the Brent-WTI spread close to parity in July 2013. However, the narrower spread then discouraged the transfer of crude oil from the Midwest to coastal regions as the spread did not cover costs from the most expensive means of transportation and it reduced refineries incentives to process crude oil through lower margins. In September, the start of the refining maintenance season and ongoing supply growth in the Midwest had put an end to the decline in crude oil inventories in the Midwest and triggered a rebound in the spread which reached more than $10 per barrel in October. Will the spread remain at this level? This is not likely due to the upcoming events. Indeed, refineries in the US are ramping up after having performed their seasonal maintenance work. The current wider spread has indeed led to stronger margins, encouraging refiners to increase activity as much as possible. Moreover, the spread is now wide enough to cover the costs of transportation from the Midwest to coastal regions, especially to the West and the East Coast. Moreover, the start of two major pipelines connecting the Midwest and the Gulf Coast are likely to add significant upside pressure on WTI in the coming months. Indeed, TransCanada is expected to launch by the end of the year the 700’000 b/d Gulf Coast pipeline, which will carry crude oil from Cushing to Houston. Furthermore, the 400’000 b/d Seaway pipeline, which is linking the same areas, is expected to be expanded by 450’000 b/d in Q1 2014. These pipelines are likely to lead to further drawdown in inventories at Cushing, adding upside pressure on WTI. Thus, stronger refining activity and the improved pipeline infrastructure should allow the Brent-WTI spread to narrow back to around $5 in the coming months. The spread could even narrow further as it tends to overshoot when crude oil inventories are falling rapidly at Cushing. For more details on this theme, please contact sales@diapason-cm.com |
|
|
For the full version of the Diapason Capital Markets report, please contact info@diapason-cm.com