
October 28, 2013
Another wave of liquidity coming; how will commodities benefit from it?
Commentary by Senior Market Strategist Robert Balan
«Central bankers always try to avoid their last big mistake. So every time there's the threat of a contraction in the economy, they'll over stimulate the economy, by printing too much money. The result will be a rising roller coaster of inflation, with each high and low being higher than the preceding one.»
Milton Friedman
With a growth uptick apparent in the US despite the twin political debacles culminating in a government shutdown and in the debt ceiling impasse, and improved activity outlook in Europe, shouldn't central banks be on the lookout for reasons to tighten monetary policy? So why many central banks have cut borrowing costs in the past two months?
What is clear is that there is concern the uptick in growth seen lately could be another false start in their economies. The central banks do not have to look far for encouragement to make sure they are not lured into another trap -- the latest policy attempt of the US Federal Reserve to achieve escape velocity is QE3. The right context to take this regard is that QE1 and QE2 had been failures in the sense that the programs had not provided the requisite economic boost that would have made a QE3 unnecessary. This time around, the central banks are showing they have learned from that, and are taking measures not to make the same mistake.
Commodities are likely to benefit from this situation through various channels. Indeed, the US dollar is likely to depreciate further as monetary easing from the US Federal Reserve are likely to persist until at least March 2014 and would have more impact on the currency than monetary easing in the rest of the world (except for the Yen and CHF). Moreover, the flattening of the US Treasury yield curve, triggered by the accommodative monetary policy, will make more attractive high-yielding emerging markets currencies, encouraging carry trade and consequently add further downside pressure on the greenback. Dollar-denominated commodities should hence benefit from a weaker dollar.
Furthermore, the increase of the carry trade should also have a positive impact on commodities as it typically results in growing Foreign Direct Investment in emerging markets. These investments are usually contributing to stronger growth. The appetite for commodities through the acceleration of the economic growth is being amplified by growth-oriented monetary policy implemented by central banks in emerging markets, such as Chile and Mexico. Demand for commodities and especially base metals is hence likely to accelerate in the coming months. The pro-cyclical base metals market segment could benefit the most from this situation.
 |
Main drivers this week
|
Commodities and Economic Highlights
Commentary by Robert Balan, Alessandro Gelli, Marion Megel and Alban De Rougé
Strong LLS-WTI correllation implies the glut moved to the Gulf Coast
The Brent-WTI spread recently widened to more than $12 per barrel, the highest level since April 2013. The build in crude oil inventories at Cushing, Oklahoma marked the end of a sharp drawdown in inventories. This came on top of higher crude oil inventories in the rest of the Midwest. Both elements contributed to weaken WTI price relative to Brent. However, these were not the only factors behind the wider spread.
Indeed, while these past few years WTI price diverged from coastal crudes, which were linked to (and followed) Brent price, the former is now moving along side Light Louisiana Sweet (LLS) price, a benchmark of light sweet crude oil on the US Gulf Coast. The change in correlation is significant. The sharp LLS discount to Brent, which reached around $10 per barrel, reflects the oversupply situation of the US Gulf Coast and is discouraging imports of crude oil, especially of light sweet crude oil.
Three factors contributed to this oversupplied market. First, crude oil production in Texas continues to grow at a rapid pace and most of the output is now directly being sent to refineries on the Coast (without transiting through Cushing like it used to) thanks to new pipelines. Between January and September 2013, crude oil output at the Eagle Ford Shale and in the Permian basin was up by 525’000 b/d y/y. Moreover, improved rail and pipeline infrastructure have allowed crude shipment from the Midwest to refineries on the US Gulf Coast to increase. Between January and July 2013, crude oil shipment from Midwest to the Gulf Coast rose by 230’000 b/d y/y.
The last factor is the ongoing refining maintenance season, which has led to a decline in crude runs by about 800’000 b/d since July 2013 on the Gulf Coast. These factors contributed to a sharp rise in crude oil inventories on the Gulf Coast, which rose by 17.1 million barrels in the past five weeks, accounting for 70% of the rise in total crude oil inventories during this period. However, refiners on the Gulf Coast are expected to boost activity soon as maintenance work is about to end. This is likely to mitigate the two other factors and could contribute to reduce the oil glut.
Silver loosing its lustre
Since the summer 2013, silver prices have strongly outperformed gold. The gold : silver ratio has indeed fallen from 65 at the beginning of August (a level which had not been reached since the summer 2010) to 59 recently, back below its 30-year average of 61.7.
The grey metal’s decent performance has been encouraged by two forms of investments. On one hand, professional investors have been trying to benefit from the price volatility using forwards, futures and options. Silver’s volatility has indeed averaged 31% since January this year, compared with 20% as for gold. On the other hand, retail investors have enjoyed silver’s relative cheap value (compared to gold) by using ETFs.
Professional investors seem to have very recently regained ground in gold (given expectations of lower long rates and US dollar depreciation) and could therefore start to favour gold over silver again. The latest figures for silver ETF holdings suggest that retail investors may be losing confidence too. Silver holdings have continuously risen from the end of June to the end of August this year (by 5%, compared to net outflows of nearly 9% as for gold ETFs holdings), but the holdings’ curve has formed a plateau since then, and has even kinked in October, showing a net outflow of 1% month to date. The poor fundamental picture for silver could further encourage disinvestments, as industrial demand should remain grim in 2013 and 2014, affected by the subsidy cuts to the photovoltaic sector in China, Spain and Germany.
Is the nickel rally sustainable?
Nickel has experienced a strong rally in these past days, having risen by more than 4% from the 18th to the 24th of October. Much of the rally has been driven by speculative activity, and hence a set back should be expected in the short run. The latest LME warrant holdings data indeed showed the presence of a dominant holder of spot warrants, capturing 40-49% of the exchange’s warrants. In addition, market participants have also reported some strong short covering activity (particularly intense as nickel has been traders’ favourite short play so far this year), which, given the lower liquidity in the market caused by the dominant warrant holder, has pushed prices higher.
This speculation has also been accompanied by some fundamental support. Nickel’s poor fundamentals have long been priced: the metal is the worst performer YTD, and is down 50% from its early-2011 highs, compared with returns of –25% and –30% for the other base metals over the same period. The recent rally suggests that the market is finally acknowledging that all is not that gloom for nickel: despite the ongoing projects and the expected surge in Chinese nickel pig iron (NPI) production for 2013 and 2014, the market could tighten because of a possible Indonesian ore export ban from January 2014.
Indonesia accounts for more than half of China’s nickel ore imports, used in the making of NPI. Needless to say that such a ban would drastically impact NPI production or raise its production costs, making the material less competitive compared to refined nickel. In addition, producers in the ROW are also starting to curtail output as a third of them are currently delivering negative margins. Given nickel’s poor performance and grim fundamentals, the slightest downside surprise on the supply side could provide strong support to prices.
However, the Indonesian export ban needs to be clarified and legally approved by the Supreme Court. Fundamentally speaking, despite the obvious support on the supply side, we believe that markets need further indications of tightening and a rebound in stainless steel demand, for the rally to be truly sustainable.
A revival in corn and soybean crops delays harvest
After three weeks with no official data due to the US government shutdown, the US Department of Agriculture (USDA) published on Tuesday the highly watched Crop Progress report. 60% of corn is rated “good” or “excellent”, a rise of 5 percentage points since the last report was released 21 days ago. The largest increases came from states situated in the heart of the Corn Belt.
For example, the percentage of corn rated “good” or “excellent” in Iowa, the biggest growing state for corn, was revised upwards by 9 percentage points to reach 45%, the highest level since mid-August. Second-ranked state Illinois, fourth-ranked Minnesota and Indiana, expected to have the fifth-biggest crop, experienced, each, a gain of 6 percentage points minimum. Moreover, these states between them have been estimated by the USDA to produce some 6.5 billion bushels of corn, which is nearly half the national crop.
The condition of Soybean also increased by 4 percentage points with 57% rated “good” or “excellent”. Illinois, Indiana and Iowa, all in the 5 top producing states for soybean, have once again experienced a gain of 6 percentage points minimum. These increases were possible thanks to a late-season improvement. Recent rains will help yield to recover from the dry summer. Therefore analysts expect USDA to increased both corn and soybean production forecasts in the next monthly WASDE report. However, the conditions of both crops are still below the average. Indeed, during August, dry and warm conditions in central and western Midwest – temperatures were above 38 degrees Celsius in much of the western Corn Belt – stressed corn and soybean crops.
Another issue showed in the crop progress report is the harvest delay. Only 39% of corn has been gathered versus a 5 year average of 53%. The delay is mainly due to the recent rains in the Corn Belt. The above mentioned states have all experienced a delay of 10 percentage points minimum. Even if the gap is smaller, the same remark can be made for soybean crop. Only 63% has been harvested, which is 6 percentage points less than the 5 year average. Therefore, the quality improvement was made at the expense of the harvest. This past week, Iowa and Illinois experienced only 5.5 suitable days for fieldwork whereas Minnesota experienced a worst situation with only 3 days.
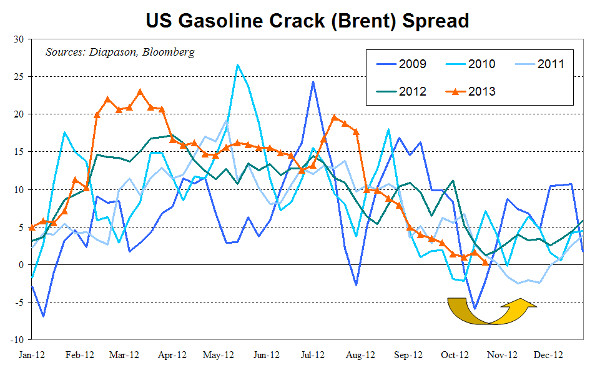
Chart of the week: Gasoline crack spreads are set to rebound
|
Gasoline crack spreads have recently fallen to low levels, driven by a weaker seasonal market and fragile fundamentals. The gasoline crack spread using Brent indeed fell to around $1 per barrel, down from around $19 in mid-July. September and October tend to be a period when downside pressure on gasoline increases due to the end of the US driving season and the switch towards winter gasoline grade, which is cheaper to produce. Moreover, this year, gasoline underperformed the oil sector due to the relatively high level of gasoline inventories, weak demand and the expected reduction in biofuel mandate for 2014, which will decrease the use of ethanol for refiners and blenders. These factors are nonetheless likely to gradually be offset by improved gasoline demand. Indeed, the economic recovery in the US, which is the most important gasoline market, accounting for about 40% of global gasoline use, has triggered a rebound in vehicle sales. The latter is in turn likely to offset the recent decline in gasoline demand due to the vehicle fleet upgrade as the light trucks sales growth was above 10% between April and August 2013, a significant improvement compared to the last two years. Despite last week’s decline, US implied gasoline demand has improved and averaged these past three weeks 8.9 million b/d, up 300’000 b/d from last year. Moreover, gasoline demand, which tends to seasonally bottom in October, is set to rebound and should peak by year-end during the Christmas holiday. Furthermore, low refining margins especially in Europe, should lead to a lower increase in refining activity after the end of the maintenance season and could even trigger the closure of one or more refineries. This should reduce gasoline supply (and offset the expected rebound in refining activity on the US Gulf Coast), while demand rebounds, adding upside pressure on gasoline crack spreads. Moreover, the seasonal pattern of gasoline prices implies an outperformance of gasoline. Thus, gasoline crack spread are likely about to end their downside trend and hence are close to interesting entry levels. For more details on this theme, please contact sales@diapason-cm.com |
|
|
For the full version of the Diapason Capital Markets report, please contact info@diapason-cm.com