
October 21, 2013
After the "Debt Ceiling" scare: position for a year-end rally
Commentary by Senior Market Strategist Robert Balan
«The national budget must be balanced. The public debt must be reduced; the arrogance of the authorities must be moderated and controlled. Payments to foreign governments must be reduced, if the nation doesn't want to go bankrupt. People must again learn to work, instead of living on public assistance.»
Cicero, 55 bc
Our (and the market’s) baseline scenario on the US debt ceiling issue that an agreement will be reached on extending the debt ceiling largely came to pass. But there is no elation warranted here — the episode has been very costly for the US in both economic and political terms. The US brand has been damaged, and the 11th-hour deal provides nothing but a brief relief — the politicians will have to go through this again by year-end.
The brief government shutdown compounded the situation — it is clear that the three-week furlough of Federal employees has damaged the economy in more ways than one. Consumer purchases have been skipped, and corporate capital expenditures delayed. The only saving grace is that the US economy still packs a lot of torque, which may yet push Q4 2013 GDP growth to, or even slightly above, trend.
There are silver linings (in a manner of speaking): history shows that in the 30-45 days following government shutdowns, interest rates fell 40 basis point on average. This, by itself, is enough to bring the 10yr yield back to circa 2.0%. Moreover, the brief political truce kicks the debt-ceiling can down the road to January 2014, thereby overlapping the transition of a Bernanke Fed to a Yellen-led FOMC. This simply means that the prospects of further political battles plus transition paralysis will keep the Federal Reserve from considering any plan of tapering QE3 securities purchases until March 2014, at the earliest. And furthermore, if our modeling work is correct, by the time the Fed is ready to consider a plan to taper, the macro data may be in such a parlous condition that the central bank would consider adding more to QE3 purchases instead of slimming them down.
This is in effect, would extend the Federal Reserve “put” on risk assets which we have previously discussed. This virtual put may even extend to the middle of 2014, even if conditions do not deteriorate as much as our modeling work suggest. This is a powerful positive jolt to the market — which practically provides the market with a "free lunch", similar to the episode which we saw in 1999, when the S&P 500 rose from 1190 to 1440 by year-end, as the market understood then (as now) that the Fed will be on hold for a long while. The recent powerful uptake in risk assets prices suggests that the markets understood this too. This is why we have chosen the title of this report as a rallying cry for all risk assets, commodities included. Furthermore, China and EM developments have been a favorable force in this environment, extending the validity of the arguments to buy assets that are leveraged for a global recovery.
 |
Main drivers this week
|
Commodities and Economic Highlights
Commentary by Robert Balan, Alessandro Gelli, Marion Megel and Alban De Rougé
Will backwardation on crude oil futures rebound?
Following a tight oil supply/demand balance during the summer, the backwardation on Brent futures recently fell the lowest level since the beginning of July, while the WTI November futures contract moved back into contango. Will the curve on crude oil futures contracts weaken further?
Looking at the dynamics behind this move, 2 main factors arose. First, crude oil prices are being affected by the seasonal weakness as oil demand tends to decline in September and October following the driving season and as the heating season has just started. During this period, refineries tend to perform maintenance work, leading to reduce crude oil demand. The refining maintenance season’s impact on the crude market has been amplified this year due to low refining margins, especially in Europe, encouraging refiners to cut crude runs by a larger than normal amount. This followed an extremely busy summer, when global crude runs reached record levels.
The second factor is the current rebound in crude oil supply, as previously discussed. The first factor is not likely to last as oil demand typically rebounds in November, which also corresponds to the end of the refining maintenance season. Consequently, this should gradually offset the impact of the second factor. Even if the rebound in refining is likely to be weaker than usual, oil prices should benefit from a stronger demand for petroleum products during this period triggered the heating season and improved economic conditions.
Moreover, WTI futures are likely to benefit from the upcoming start of TransCanada’s Gulf Coast pipeline, which will carry crude oil from Cushing in Oklahoma to Houston on the US Gulf Coast, decreasing costs to transport crude oil between the two regions and hence adding upside pressure on WTI prices. This, on top of the end of the refining maintenance season in the US Midwest, should contribute to the return of WTI into backwardation by the end of the year and a narrower Brent-WTI spread.
Gold physical demand slows down but should recover soon
China may Late last week, gold jumped in huge volumes, as the December contract traded with a daily volume 10% higher than the usual average. The yellow metal indeed enjoys relatively positive fundamentals at the moment (i.e. expected weakness of the US Dollar, expected decrease in long interest rates, see last week’s Diapason Commodities Insight Weekly, October 14 2013), and this should therefore trigger an improvement in investment demand in the coming months, supporting gold prices.
On the other hand, physical demand has been tarnished in the past weeks. India’s imports of gold are collapsing to record lows, around 7 tonnes per month, well below the 70 tonnes imported during the same period last year. The fall of the rupee and the government’s efforts to curb the trade deficit by raising gold duties are finally working. Also, in the US, sales of American Eagle gold coins fell further in September, down 80% y/y to 13,000 ounces. The latest IMF statistics also show that central banks’ buying has been paused, and actually turned from a ten-year high net purchase in May this year to a net selling in July. Official purchases were strong drivers behind higher gold prices from 2010 to 2012.
We however expect physical gold demand to recover soon, especially in India as the period from October to February is seasonally strong for gold purchases due to the occurring of the festival and wedding seasons. In addition, China’s gold imports have remained strong since prices started to fell this year: they hit a record high in March and have been kept above 100t per month since then, the second highest monthly import volume ever.
The combined improvements in investment and physical demand should support gold prices, which could head towards $1,450-1,500 an ounce by the end of the year.
Copper mining supply is growing, but struggles to deliver incremental refined output
The global copper market has been showing signs of ease in the past weeks, after having reported a deficit in H1 2013. We expect the red metal’s market to be more or less balanced by the end of the year and to report a surplus in 2014, as mining projects have started to materialise into more output. However, the situation is not that simple: despite the supply growth, production has proved to be below expectations again this year, supporting copper prices. In addition, the copper mine production growth may not translate as easily into incremental production of refined metal, as global smelting capacity could be insufficient.
This picture has been evidenced by the opposite directions taken in the past weeks by treatment and refining charges (TC/RCs) on one hand, and consumers’ premiums on the other hand. TC/RCs are usually a very strong indicator of the global copper market balance: a rise in these charges (smelters charge miners a higher fee) suggests that mine output is rising. So far, the negotiations for the 2014 TC/RCs are on the rise: the German producer Aurubis expects benchmark charges to rise from $70/t-7c/lb this year to around $95/t-9.5c/lb in 2014. In China, some spot deals have been agreed at circa $100/t-10c/lb. On the other hand, physical premiums are showing that the market remains short of refined copper: in September this year, reports have shown that Codelco is considering raising its premiums for Japanese buyers by 45% this year, from $85/t set for 2013 to $123/t for 2014; and for Chinese buyers from $98/t to $135-140/t, the highest level since 2007. Auribus is also considering raising premiums by 22% to around $105/t.
These opposite numbers imply that the rise in TC/RCs is mostly the result of insufficient smelting capacities and not solely by an increase in concentrates supply. Shutdown of smelting capacities have been decided in Europe and China, due to a shortage of scrap copper, which is expected to drop by 300,000t at least this year. Consequently, miners may struggle to turn their copper concentrate into refined product for some time. The question now is: how fast will smelters ramp up production capacity in the coming months?
Soybean consumption at the lowest level
On September 2013, the US soybean consumption reached the lowest level ever for this time of the year, except the year 2009, according to the last data published by the National Oilseeds Processors Association. Only 108.68 million bushels (Mb) were crushed in September, which is 9% less than last year and slightly above the 107.38 Mb of 2009.
In the final weeks of the summer, cash basis levels at key demand markets seemed to confirm the scarcity of soybeans by pushing the seasonal basis during August to multi-year highs. Reports of crush plants weighing the curtailment of activity until fresh supplies were eventually harvested seemed to offer further proof of a general dearth of soybeans. However, analysts anticipated even a smaller number around 106 Mb. It seems the tension evaporated over the course of September as most of the crop across the Midwest entered its final growth stages amid friendly weather conditions and as the earliest soy harvests in the South started to take place.
This low level of consumption is coming from the disappointed 2012 soybean harvest, which was decimated by the worst drought in 50 years. Indeed, the US produced only 82 million tonnes, 10% less than the record quantity obtained during the season 2009-10. Measured by the USDA, stocks as of the 1st September 2013, representing the ending stocks for the season 2012-13, reached only 150 Mb. It is just 15 days of use, the lowest level for the last 50 years.
Next month, the consumption should rebound as soybean is currently harvested in the US. 11% of the soybean was harvested as of the 29th of September, data from the USDA showed. Since then, no official numbers has been published because of the government shutdown but private analysts estimates the harvest half-finished.
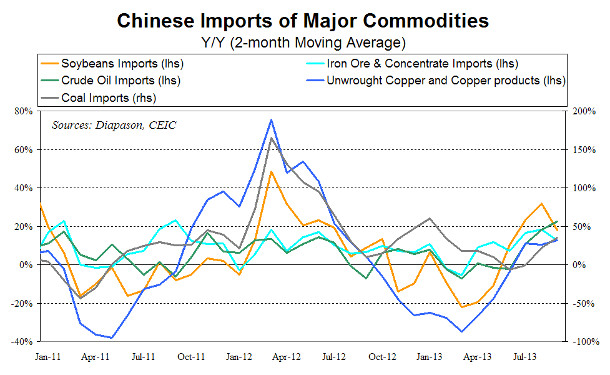
Chart of the week: Strong Chinese imports confirms the acceleration of economic growth
|
Latest GDP data confirmed the recovery of the Chinese economy. The growth of GDP at 7.8% is the result of looser monetary policy and a mini-stimulus of investment in infrastructure, especially in rail and subway systems. These investment naturally were positive for commodities demand, which indeed recently strengthened. Chinese imports of major commodities consequently accelerated these past few months, confirming the strong link between commodity demand and the health of the Chinese economy. Chinese crude oil imports reached 6.3 million b/d in September 2013, a new record high. During Q3 2013, Chinese crude oil imports grew by 1.0 million b/d y/y, a significant improvement from the Q1 and Q2 2013, when Chinese crude oil imports growth stood at respectively –60’0000 b/d y/y and –10’000 b/d y/y. Coal imports growth also accelerated to +29.6% y/y in Q3 2013, rebounding from +0.7% y/y in Q2 2013. Moreover, imports of metals also recently improved. In September 2013, total Chinese copper imports (unwrought copper and copper products) grew to 457’847 metric tonnes (MT), up 15.9% y/y and the highest level in 18 months. Iron ore and concentrate imports reached 74.6 million MT in September 2013, outpacing the previous record high made in July 2013 (at 73.1 million MT), signalling an acceleration of the economic activity. We expected the Chinese GDP to grow by 7.9-8.0% in Q4 2013 and by around 8.2% in the first part of next year, more than offsetting the weak first half of 2013 and contributing to stronger demand for major commodities. As already exposed, base metals, the most cyclical commodity sector, are expected to benefit the most from the Chinese recovery. |
|
|
For the full version of the Diapason Capital Markets report, please contact info@diapason-cm.com