
October 14, 2013
Interesting entry levels for Gold
Commentary by Senior Market Strategist Robert Balan
«Clearly the outlook for the currency markets, and in particular the U.S. dollar/euro exchange rate will be critical to the outlook for the gold market.»
Alan Williamson
Gold and silver prices have fallen sharply since the Republicans’ announcement to delay the resolution of the debt-ceiling issue. The decline is offering interesting entry opportunities for investors as the market is likely to turn sooner rather then later. We believe that the improvement in precious metal prices will not come from a deterioration of the political situation in Washington but will actually find its roots in deeper and fundamentally-driven factors that market commentators have chosen to neglect for the moment: the world liquidity and the decline in real interest rates, as well as the depreciation of the US Dollar – all triggered by the reaffirmation by the US Fed on September 18th that the asset-purchase program would be left intact this year.
Since slightly before the mid-April sell-off that saw gold prices suffering the strongest percentage fall in thirty years, investors have turned their back on gold, mostly based on higher real interest rates, and despite the fact that such rates were probably too strong to allow a more sustainable economic recovery. Now that the US Fed has reaffirmed its $85 billion per month of asset purchases, that the BoJ continues to flow and equivalent of $75bn monthly and that other central banks are pumping money as well, the risks of seeing a persisting increase in real interest rates and a deceleration in the world liquidity have faded. A close correlation between gold prices and central banks’ assets has been observed in the past decade, with the past six months being an abnormality in this correlation.
The past weeks have also witnessed a decrease in real interest rates, with the 10-Year Treasury yield falling from 2.88-2.90 in the days preceding the September 18th FOMC meeting to a 2.68 as of 9 October 2013, dragging the real interest rate from nearly 1.40% to 1.16% over the same period. Although these rates are still into positive territory and far above the 2012 and H1 2013 levels, we believe rates should continue to trend downwards for the rest of the year.
Another direct impact of the Fed’s decision was the depreciation of the US Dollar: the U.S. dollar index (DXY) broke the 81.00 support, and fell further to around 80 last week. A consolidation may be followed by further decline to 77.00 by December, as the US activity data will likely prove below expectations, resulting in lowering fears of an early-QE-tapering. In particular, signs of a break in the residential market recovery have emerged, and recent declines in housing starts and home sales will likely translate into further negative pressure on US housing activity. Also, the recovery in employment is now at risk of being reversed as the Labor Force Participation Rate could bottom soon. There has historically been a very close correlation also between gold and the USD and with the sentiment over the USD. Moreover, the sentiment on gold remained at low level, implying that the precious metal is oversold.
The expected decrease in real interest rates, increase in global liquidity, the depreciation of the USD and the current weak sentiment should provide good support for precious metals and for gold in particular, which could hit $1,450-1,500 an ounce by the year-end.
 |
Main drivers this week
|
Commodities and Economic Highlights
Commentary by Robert Balan, Alessandro Gelli, Marion Megel and Alban De Rougé
Stronger transportation activity is boosting oil demand
Recent manufacturing PMI data in several countries suggested a stronger economic activity. This was also reflected in other data such as transportation data. This is having a positive impact on oil demand, as the transportation sector remains the most important component of oil demand, accounting for about 70% of oil products use in the US. It is interesting to see that it is not only stronger road activity, which contributed to the strength in oil demand but also the shipping and airlines sector.
Indeed, according to the latest port data, containers throughput at major ports recently accelerated. The port of Shanghai saw its containers throughput reach 2.95 million in August 2013, up 13.4% y/y, a new record high level and the strongest growth since October 2011. This is suggesting that the economic activity in China is starting to accelerate as last year slowdown in growth was also reflected in the lower shipping activity. Container throughput growth at the port of Shanghai indeed fell from an average of +9.4% y/y in 2011 to +2.8% y/y in 2012 and has improved to +4.2% y/y in average between January and August 2013.
Moreover, global airlines revenue passenger traffic was up by 7.5% y/y in August 2013, the strongest growth since March 2012. Activity for most airlines are indeed growing at a faster pace, rebounding from early 2013 lows. The rebound in activity in the airline and the shipping sector is triggering stronger demand for transportation fuel.
On the road, oil demand has also been improving. Strong vehicle sales in the US (light vehicle sales were up 11.1% y/y in July and in August 2013) had nonetheless a mixed impact on oil demand as most new vehicle sales are replacing existing vehicles, implying the US fleet is becoming more efficient. On the other hand, strong US light trucks sales (+12.9% y/y in September), which continues to hold a good correlation with US gasoline consumption, contributed to boost US gasoline demand, which was up by 245’000 b/d y/y in July 2013. Since February 2013, light truck sales growth was above 10%, up from +8.5% y/y in average in 2012.
Indian diesel demand could decline
While oil demand recently improved in the US, in Europe and is expected to grow at a more rapid pace in China and other emerging markets as the global economic growth is increasing, the situation in India still provides little support for oil demand growth. Indeed, the improvement in the manufacturing PMI, which moved from 48.5 in August 2013 to 49.6 in September 2013, signalling a less important contraction in manufacturing activity, was offset by the decline, during the same period, in the services PMI from 47.6 to 46.1, the lowest level since March 2009.
Moreover, the weakness in Indian oil demand growth is due to other than purely economic growth factors. Indeed, the strength in Indian oil demand growth in 2012, which was the world’s third strongest, was due to drought and power blackouts, which boosted the use of diesel for power generation and for pumping water. Thus, diesel demand growth was up by 105’000 b/d y/y in 2012, a significantly stronger growth than previous years. However, this year, the heavy monsoon boosted hydroelectric generation and reduced the need to pump water, leading to a decline in diesel use by 30’000 b/d y/y in June 2013 and by 80’0000 b/d y/y in July 2013.
Furthermore, the important depreciation of the Indian rupee has increased sharply the cost of imported oil. Although subsidies on petroleum products have insulated consumer from the direct impact of the rise in prices, the Indian government cannot afford the burden of the subsidies and wishes to reduce them. Malaysia already increased prices on gasoline and diesel by more than 10% in September 2013. The Indian government already slightly cut diesel subsidies in January 2013 and could cut subsidies further.
The slower economic growth and the increase in retail prices are likely to affect oil demand. However, the incoming general elections, which will be held in May 2014, may discourage the government from reducing diesel subsidies by a significant amount until then.
China’s copper restocking cycle has begun: imports to remain high
China may have started to rebuild its copper inventories since August this year, after domestic copper inventories appeared critical in July, at their lowest level since January 2012. Inventories have started to move upwards, although slowly, as suggested by the estimated inventory levels held in bonded warehouses, which rose in August to about 400,000 tonnes, from 370,000 tonnes in the previous month. Copper inventories held at SHFE facilities have continued to hover in a range between 150,000 and 160,000 tonnes in the past week and so far provide little direction regarding the industrial copper use.
At the same time, copper imports have remained high in China. The latest statistics show that imports in July 2013 hit a 14-month high at 410,700 tonnes, and only slightly retreated in August to 387,600 tonnes from these high levels, despite the seasonal activity lull usually observed in August. We believe that all copper imports actually bottomed in April this year at 295,800 tonnes and are about to stay elevated this year, in support of this restocking cycle. October should see a temporary retreat in imports though, due to the holiday period which usually also witnesses a slowdown in economic activity.
China’s import levels are mostly driven by stocking cycles. The relatively low copper import volumes from January to June 2013 occurred when China was experiencing a destocking phase, characterised by users supplying themselves with material held in domestic warehouses instead of importing the material. January-June 2013 imports therefore averaged 213,000 tonnes. Although most commentators attributed the lower import volumes to a possible “hard landing” in China, they were actually the result of the destocking cycle after domestic inventories (bonded and SHFE) approached the record high of 1.2 million tonnes at the end of 2012.
The coming months should witness a steady rebuilding of inventories, similar to that of the first half of 2012, when imports averaged 273,000 tonnes a month. Another positive indicator for the Chinese copper market is that copper inventories are improving slowly, despite the big import volumes. This means that the market is being driven, in addition to the restocking demand, by some real underlying consumption. The need for imports should in particular be dictated by the ongoing massive infrastructure plans to develop the power and the railway networks.
The oversupplied sugar market
Since the beginning of the year, sugar prices have dropped by 10%. The main reason lies in the abiding supply in the market. Indeed the new season 2013-14, which starts this month, will represent the fourth consecutive season of surplus. According to the International Sugar Organisation, ending stocks are estimated to increase by 4.5 million tonnes (Mt) after a rise of 10 Mt last year.
Brazil, the largest producer, is expected to gather a record of 41 Mt, according to data from the Brazilian governmental forecasting unit Conab. In India, the world’s second largest producer, harvest should reach 24.5 Mt thanks to a good monsoon.
Despite the drop in prices, farmers are still planting larger area. In fact, they have enjoyed a relief from the massive currency depreciation. Brazil has benefited from a very weak BRL currency, which allowed it to enjoy much higher prices in local terms than otherwise would have been the case. As a result, a price level of 17 or 18 US cents per pound can cover production costs.
Recently, prices have slightly rebounded above 18c/lb, as China, MENA and other Asian markets took advantage of lower prices to stockpile sugar. However, market positioning of speculative investors has been negative on balance since February. Hence, these market participants remain sceptical regarding the prospect of a price recovery. Therefore, a notable price recovery is unlikely in the present environment characterised by high output and weak currencies in important producing countries.
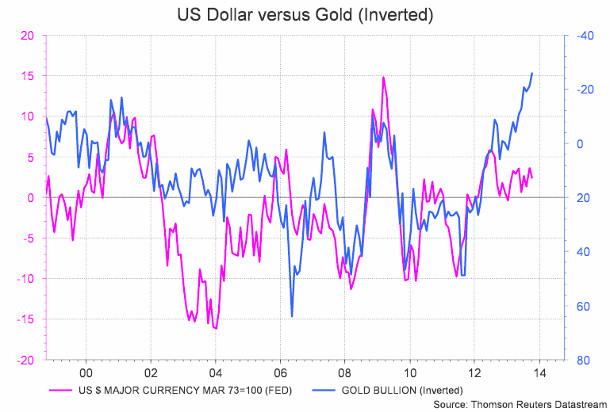
Chart of the week: Gold is undervalued relative to the US Dollar
|
The long time correlation between gold and the US dollar has recently faded. Gold prices now appear severely undervalued relative to the US dollar. The expected weakness in the US dollar should put an halt in the drop in gold prices and allow the precious metals to rebound, supported by other factors mentioned in the main commentary. We thus strongly believe that the US dollar and gold prices should converge again. |
|
|
For the full version of the Diapason Capital Markets report, please contact info@diapason-cm.com