
October 7, 2013
Base metals to lead as manufacturing turns higher
Commentary by Senior Market Strategist Robert Balan
«China is emerging as a key growth engine for the world economy, contributing over a quarter of total global growth in recent years, more than any other country. The downside for U.S. consumers and businesses is that this is forcing global commodity prices higher.»
James Scott Anderson
After the closely watched FOMC’s meeting in September 2013, financial market participants are again focusing on the US. This time it is the Capitol which is under the spotlight. The recent government shut down, which had a marginal impact on asset prices, is only the first act of a more dramatic turn of events. Indeed, the most important concern in financial markets is the debt-ceiling issue, which needs to be resolved before October 17 or the US will be in technical default (an event which we believe will be preempted by the US Congress with another Continuing Resolution). But as everyone is focusing on the US, recent economic data from all around the world were put aside by financial markets. Indeed, improved economic conditions not only in developed countries but also in developing countries (confirming our last week call that emerging markets are back).
Recent stronger-than expected Chinese data have allayed hard-landing concerns, supporting growth outlook, contributing to the outperformance of the renminbi relative to its regional peers and triggered a recovery in the Shanghai Composite Index. Chinese GDP growth is expected to accelerate next year to 7.7% from 7.4% as the extraordinary measures taken by the new government to prop up growth increasingly takes hold.
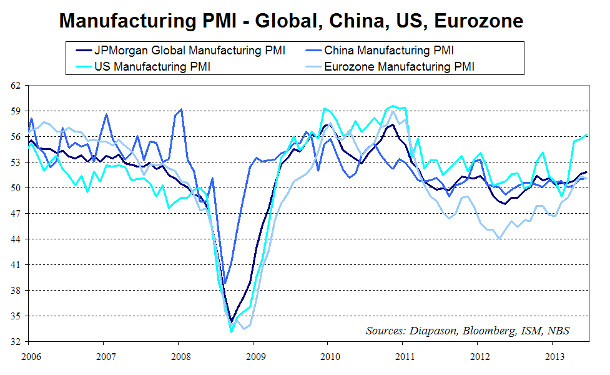
Moreover, latest manufacturing PMI have recently accelerated. In September, manufacturing activity improved in all major emerging markets except Russia and Mexico and continues to growth in Europe albeit at a slower pace than in August. In the US, manufacturing PMI increased more than expected in September to 56.2, the highest level since April 2011. This contributed to raise the Q3 2013 average to 55.8, from 50.2 in Q2, and supporting gains in UST yields. Global new export order posted the most noteworthy increase since May 2011. This has translated into the rise of the JPMorgan Global Manufacturing PMI from 51.6 in August to 51.8 in September, the third consecutive rise and the highest level in 27-month.
The improved global growth conditions all over the world reminds of 2009-2010 when the global economy moved higher in synchronization, which was particularly positive for asset prices and especially commodities. During this period, base metals outperformed both other commodities and other asset classes as they are the most cyclical commodities due to their heavy industrial use.
The linkage between base metals and China, which consumes nearly half of the world's metals, is particularly important, as illustrated by the strong correlation between base metals prices and the Chinese PMI. Base metals were also supported in 2009-2010 by high import levels from China, and the recent rebound in this metals trade also suggests that a scenario similar to 2009-2010 could soon occur. Furthermore, as the base metals consumption in Europe and the US accounts together for about 35% of global use, the synchronized acceleration of global growth suggests that base metals, which have been the lagger in the commodity space for the past year and a half, should start outperforming not only commodities but also other asset classes.
 |
Main drivers this week
|
Commodities and Economic Highlights
Commentary by Robert Balan, Alessandro Gelli, Marion Megel and Alban De Rougé
Russian refineries are having more impact on the oil market
Global crude runs, which reached high levels during the summer, started to decline in September. Refineries are typically reducing activity during the fall for maintenance work as petroleum products demand tends to be seasonally weak during this period, which occurs between the end of the driving season and the start of the heating season. This year, the decline in refining activity is expected to be more important than usual due to low refining margins in Europe and some parts of the US, reducing crude oil demand.
In Russia, the refining activity is also having an important impact on the crude oil market. Recent investment in the downstream sector allowed some Russian refineries to increase margins, thanks to exports of premium products. This encouraged them to push activity to high levels. Thus, despite the increase of Russian crude oil production by 130’000 b/d y/y on average between January and August 2013, Russian crude oil exports fell by 110’000 b/d y/y on average due to the strong refining activity during the same period.
Russian crude runs indeed rose by 200’000 b/d y/y on average during the same period to 5.5 million b/d and peaked in August 2013 at 5.9 million b/d, up 840’000 b/d from April 2013 level as refining activity peaks during the summer. This contributed to push Russian crude oil exports to less than 4.4 million b/d in August 2013, down 700’000 b/d from April 2013 levels.
The refining maintenance season in Russia, which started in September, is expected to be especially important this year. Crude runs could dwindle by around 600’000 b/d between August and October 2013, allowing Russia to export more crude oil. Last year, the refining maintenance season triggered an increase in Russian crude oil exports from 4.6 million b/d in July 2012 to 4.9 million b/d in September 2012.
Nickel's prospects relying on Indonesia
Nickel has continued to underperform in the past weeks and is now the worst performer year to date among base metals, down 22%. Fundamentals appear to have worsened in the past months. Demand for nickel remains soft. In the world ex-China, nickel demand has strongly contracted and reported in June 2013 its twelfth consecutive month of year-on-year decline or flat growth. In China also, despite the ongoing revival of the economy, it appears that demand for refined nickel is lagging behind, as evidenced by the domestic production of stainless steel, which improves but at a slow pace.
In addition, production is rising fast. According to the International Nickel Study Group (INSG), global nickel production has continuously been at seasonally record high levels so far this year, despite the fact that most upcoming and ongoing projects are barely profitable (especially Ambatovy, Talvivaara, Ramu). According to the INSG, the world refined nickel market was in a +120,000-tonne surplus as of June 2013.
China’s nickel pig iron (NPI) production also hit a record high earlier this year, and despite the recent slowdown, capacity should rise further next year. The impressive ramp up in NPI output has been possible through the massive imports of Indonesian nickel ore, which holds the finest properties to make NPI. However, Jakarta is planning to force the country’s miners to refine metals domestically, i.e. to limit the exports of metal ores. Authorities still need to clarify whether the export ban will be implemented or not, as the government backed down several times on the proposal. If it were to be implemented, it would affect NPI producers on the medium-term as current inventories appear sufficient to maintain production for a little while. The restrictions could also take the form of higher taxes, which would dramatically increase the production costs for Chinese NPI producers – supporting refined nickel.
Gold equities continue to underperform gold metal and equities
Since the start of commodity super-cycle in the early 2000’s, the relative performance of gold miners’ stocks has been very weak compared to the extraordinary price rally in gold prices; and this dichotomy has widened further since the end of 2011, and even more recently since the mid-April 2013 sell-off that saw gold prices tumbling the most in 30 years. The gold spot price has indeed quadrupled since 2003 (and was 4.7-times higher than in 2003 before the mid-April 2013 sell-off in gold prices), while the FTSE Gold Mines Index – gathering the world’s gold miners’ shares – has only risen 9%. Before the mid-April 2013 sell-off, the gold equities index doubled its 2003-value, still lagging far behind the performance of the yellow metal.
Even though gold stocks have not performed as well as the precious metal itself, or as stocks from other mining sectors, one should have expected a far better performance compared to other cyclical economic sectors that have gone through the severe financial crisis. It has actually not been the case: between August 2008 and October 2013, the S&P500 gained 33%, while the FTSE Gold Mines Index lost 43% of its value. This is not just because of the mid-April sell-off. From August 2008 to early-April 2013, the S&P500 was up 24% and the Gold Mines Index down 14%.
It appears that gold equity investors are increasingly irritated by this long underperformance, which was mostly caused by producers’ lack of cost discipline. In the past years, massive projects have indeed been launched, often in challenging or remote locations, at the expense of profitability. Gold cash costs indeed amount to $700/oz approximately, all-in costs (which include sustaining capex) to circa $1,250/oz, and total costs (which include growth capex) to $1,550-1,650/oz. The drop in gold prices has therefore placed gold producers in a very challenging situation. Even tough we expect gold to improve by the end of the year, miners’ margins should remain very tight, and gold equities, under pressure.
USDA stock report pushed grain prices lower
On the 30th of September, the USDA released its quarterly Grain Stocks report. The report added downside pressure on corn and soybean prices as USDA counted bigger grain stocks than expected, signalling the end of the era of critically low supplies that followed last year’s drought. The September corn and soybean stocks are closely watched by analysts as it quantifies the amount of grain at the end of the season. The data released by the USDA corresponds to the ending stocks for the season 2012-13 and therefore the beginning stocks for the season 2013-14.
Corn stored in commercial silos and farm bins stood at 823.6 million bushels (Mb), the lowest level since September 1996 but still 21% more than consensus estimates. That means that consumption, mainly feed and residual usage, slow down in the final quarter of the season 2012-13. Throughout summer, wheat traded at or near parity to corn in several areas of the US, before holding relatively steady while corn prices fell. This early parity undoubtedly encouraged the use of wheat in livestock rations and helped to further ration last year’s drought-stricken corn supplies.
Soybean stocks stood at 140.6 Mb, the lowest level since 2009 but 13% more than thought. The extra inventories reflected an upgrade to last year's harvest, by 18.6 Mb to 3’030 Mb, showing further evidence that the crop had suffered less badly from drought than initially feared. At the opposite, wheat stocks were below expectations at 1’850 Mb, due to increased wheat feeding over the summer, as mentioned above.
Chart of the week: Global Manufacturing PMIs moving higher together
|
Recent economic improvement all over the world have boosted global growth. For the first time since 2009, the manufacturing activity increased in both emerging markets and developed countries. In the Eurozone, the situation has drastically improved and allowed the manufacturing PMI to move to 51.4 in August 2013, the highest level since June 2011. In the US, the manufacturing activity again accelerated, while in China, it continues to grow at a faster pace. Manufacturing PMI also moved from contraction to growth in Australia, Vietnam and Indonesia. In Brazil and in India, the curtailment in industrial activity is easing. These factors contributed therefore to a stronger global growth. The JPMorgan Manufacturing PMI moved to 51.8, the highest level in 27-month. Like in 2009-2010, commodities, and especially cyclical commodities like base metals or soft commodities, are likely to benefit the most from this situation, which marks the end of a period of weak global growth, when the recovery in major emerging markets ex-China and in the US was offset by the recession in Europe and slower activity in China. |
|
|
For the full version of the Diapason Capital Markets report, please contact info@diapason-cm.com