
August 26, 2013
Base metals to benefit from an acceleration of Chinese growth
Commentary by Senior Market Strategist Robert Balan
« Let China sleep, for when she awakes, she will shake the world.»
Napoleon
The China “flash” HSBC manufacturing PMI for August was, for a change, a pleasant surprise to the upside – rising to 50.1, relative to the consensus forecast of 48.2 and June’s final data of 47.7. For the first time in four months this data showed expansion, and for the first time since March, it came in higher than expected. According to the press release which accompanied the data, output, domestic new orders and raw material purchases rose significantly in August.
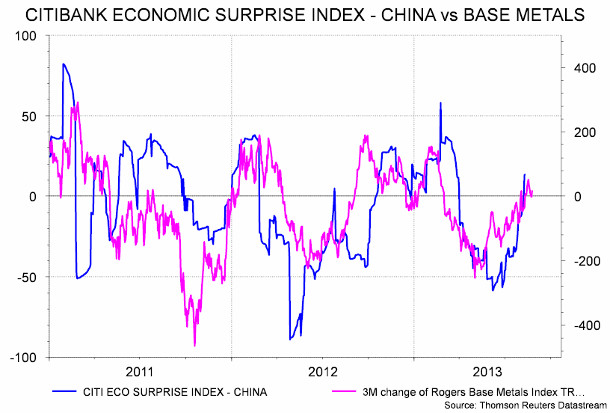
The scope of the upside surprise was illustrated by the Citi economic surprise index for China – it jumped from -12.41 to 13.60 for the week. This further boosted base metal prices, which have been held hostage in the past few months by newsflow regarding China's economy. The quarterly changes in base metal prices have a good correlation to the weekly Citi index. We now expect a better tone to base metal prices as positive market sentiment is likely to be sustained until mid-October, when the third plenum of the party congress is expected to be held.
CFTC records show that recent uplift in base metal prices was augmented by extensive short-covering. But with the better outlook in China's manufacturing activity, inventory rebuilding following a period of destocking will be driving stronger activity in Q3 2013. The new government's policies designed to stabilize growth – notably the planned acceleration of railway investment – may have also played a role in the jump in the manufacturing gauge. We expect this underpinning support to continue for the rest of the year.
The PMI surprise was actually telegraphed by the import and industrial production data for July. Imports of raw materials such as iron ore and crude oil rose significantly, while output of metals, such as steel, and cement rose at the fastest pace year to date. Fixed asset investment growth in July, led by infrastructure and office and commercial real estate also reversed the previous six months of deceleration. Moreover, the modest but steady recovery in the global economy is further helping manufacturing activity to stabilize in China.
The official NBS manufacturing PMI (due on September 1) also likely rose in August from 50.3 seen in July. We also expect trade and activity data to improve on a y/y growth basis. Moreover, a lower base for comparison in August for industrial production should also help boost the aggregate growth data. Domestic demand is still a wildcard, but retail sales have been rising in the past 6 months (although at a slow pace). Nonetheless, the improving manufacturing climate should help hasten a recovery in demand. The better-than-expected July activity, and now the robust August indicators, may mean Q3 2013 GDP growth could be better than Q2 (7.5% y/y), and may come in at 7.8% as we expected. We still anticipate growth to end the year at or above 8%.
 |
Main drivers this week
|
Commodities and Economic Highlights
Commentary by Robert Balan, Alessandro Gelli, Marion Megel and Alban De Rougé
Global oil demand to accelerate despite weaker non-OECD oil demand growth
While OECD oil demand is expected to decline by a lower amount than initially expected as seen in last week’s report, non-OECD oil demand growth is expected to slow down in the second half of the year. Indeed, latest economic data suggested that major emerging countries such as India, Russia, Brazil, Turkey and Mexico are facing slower economic activity, which will naturally affect oil demand growth.
Moreover, some specific factors are also leading to lower oil demand growth. In India, oil demand was especially strong in H2 2012 and Q1 2013, due to droughts and blackouts, which boosted oil usage for power generation and by farmers (for water pumps), as reflected by the strong demand from diesel (+80’000 b/d y/y in average between July 2012 and March 2013). This year, a strong monsoon reduced the usage of oil, leading to a decline in diesel demand in June (-30’000 b/d y/y, the first annual decline since May 2009). The slower economic growth should negatively affect Indian oil demand growth. In Brazil, oil demand fell to 2.3 million b/d in June for the second month in a row (from 2.4 million b/d in April 2013), while it usually rises during this period. Lower economic activity but also stronger ethanol production, thanks to the large sugar cane harvest, should also bring Brazilian oil demand growth lower in the coming months.
According to the International Energy Agency, Chinese oil demand grew by 490’000 b/d y/y in H1 2013, driven by strong gasoline demand growth, thanks to improved passenger car sales (+13.6% y/y in H1 2013 v. +8.3% y/y in 2012). But Chinese oil demand should only increase by around 280’000 b/d y/y in H2 2013 due to the baseline effect of the stronger oil demand growth in H2 2012 and slower economic growth. However, the slowdown in non-OECD oil demand growth will not be sufficient to offset the stronger than expected demand from developed countries as we have shown last week. Thus, global oil demand is expected to increase by 920’000 b/d y/y in H2 2013, compared to a rise of 750’000 b/d y/y in H1 2013.
The dichotomy between gold ETF and physical demand persists
Last week, the World Gold Council released its estimate of global gold demand for the second quarter of the year, and outlined that demand hit a four-year low of 856.3 tonnes between April and June. In fact, there was a 12% decline in terms of tonnage and a 23% drop in terms of value (to $39bn). The Institute also pointed a strong dichotomy between the collapsing ETF demand (that caused gold prices to fall the strongest in a single day in thirty years) and surging appetite for physical gold in the form of jewellery, coins and bars.
Unsurprisingly, a massive 402-tonne outflow from the world’s gold ETFs caused most of the decline in global demand, as a number of investors liquidated their positions, notably with the prospect of the US Federal Reserve tapering the quantitative easing program by the end of the year. Also, and more surprisingly, central banks reduced a bit the pace of their gold purchases, to the lowest quarterly level since Q2’2011.
Conversely, the abrupt fall in the gold price from April resulted in an unprecedented rush from retail investors and consumers for gold in the form of jewellery, bars and coins. Global jewellery demand soared by 37% y/y in Q2 2013; to such a degree that the purchases in terms of tonnage largely offset the effect of the price drop, since jewellery demand in value terms was still up 20%. Similarly, the second quarter also witnessed a gold coins and bars rush, generally purchased by retail investors, as demand for these products surged 78% y/y in tonnage terms and 56% in value terms.
This strong physical consumption statistics come as India and China once again dominated the market, accounting together for 60% of global demand. In the first half of the year, both countries recorded a demand up 50% from the same period last year. In particular, in the second quarter, China consumed 54% more jewels and 154% more bars and coins than in Q2 2012; while India’s demand was up 51% for jewellery and 116% for bars and coins.
Silver’s outperformance should be temporary
Silver has outperformed gold in the past weeks, amid the general rally in the precious metals sector. Silver tends to exaggerate gold moves, being much more volatile than the yellow metal, and we believe this propensity largely explains the grey metal’s outperformance. The gold:silver ratio dropped to 59 last week (as of August 23, 2013), down from the three-year record of 67 hit at the end of July 2013.
The grey precious metal has been notably supported by a rebound in the ETFs’ holdings. According to data gathered by Bloomberg, the world’s silver ETFs held 643M ounces of silver as of mid-August 2013, a 6.7% increase since the beginning of July. This should be compared with a 3% decrease in gold ETF holdings over the same period.
However, one should not try to find further supply/demand fundamental roots in this relative rally. We indeed believe that silver’s outperformance should be only temporary and that fundamentals still point toward a rising gold:silver ratio for the rest of the year. The industrial demand should indeed decelerate in the coming months, due to a crisis in the photovoltaic industry and many governments –including Spain and Germany – cutting their subsidies to the sector, which has been the strongest contributor to silver industrial demand since 2007.
On the other hand, investment demand should remain insufficient to offset the slowdown in industrial use. Retail investors should keep their silver interests in the form of coins and ETFs more or less steady; while institutional investors, who seem back on a risk-on mode, should adopt approximately the same strategy for their gold and silver holdings and should continue to prefer the PGMs, base metals and energy sectors over precious metals. Jewellery demand should also be pale as consumers could use the drop in gold prices to purchase gold jewels they could not afford just a few months ago.
On the supply-side, mine production should strongly increase this year, despite the grim demand picture. As 70% of silver mine production comes as a by-product, the supply of the precious metal is highly price-inelastic and should soar in the next 2-3 years as new copper, gold, lead and zinc deposit come online.
Growing negative sentiment on corn prices
Since the beginning of the year, corn prices have fallen by 20%, making it one of the worst commodity performer. More precisely, corn prices have declined last week to their lowest level since September 2010, a fact that is reflected in investor positions on the market. According to data from the Commodity Futures Trading Commission regulator, managed money, a proxy for investors, held a net short position in corn of 123,000 lots, as of 13th of August 2013. It is the most pessimistic positioning on the grain contract on record. Moreover, gross short positions have reached a level of 344,000 contracts for the first time ever.
This pessimistic mood is also observable in the Bullish Sentiment Index published by Consensus®. As of 9th of August 2013, only 30% of analysts questioned by Consensus® are anticipating an increase in corn prices. It represents the lowest level in 4 years. It reflects the expectations of a record US crop, thanks to huge sowings and generally benign weather conditions. Indeed, according to the last USDA report, the U.S production should increase by 28% since last year due to an increase in both the planted area and the yield. Furthermore, ending stocks are expected to double.
This situation is the opposite of last year, when investors held a net long position of 343,000 and 78% of analysts anticipated a rise in corn prices. 2012 was characterised by the worst drought in 50 years, decimating spring crops. However, the extent of the short positions, which require corn purchases to close the position and therefore represent buying pressure, has raised concerns of a sharp upturn in prices, if analysts observe a change in crop prospects, or better hopes for demand.
Chart of the week: Improving Chinese economy boost base metals prices
|
China has contributed the most to the metals super cycle in the past decade – and continues to dominate the sector as being by far the world’s largest consumer of metals. Today, the Middle Kingdom gets the lion’s share of the base metals market, devouring approximately 45% of the world’s aluminium and 42% of copper, nickel and zinc. This is therefore logical that fears of a hard landing of the Chinese economy, added to the prospects of the US Federal Reserve tapering its QE program, have strongly affected base metals prices from the second half of last year until recently. However, these concerns about China have eased in the past weeks as latest statistics point toward an acceleration of the country’s economy – HSBC flash PMI for August rising to 50.1, Citi economic surprise index for China jumping from -12.4 to 13.6 as for the most recent indicators – and therefore of the domestic demand for base metals – as illustrated by the latest very strong import statistics. Along with the acceleration of the Chinese economy and the improving market sentiment, we expect base metal prices to head upward in the coming months. |
|
|
For the full version of the Diapason Capital Markets report, please contact info@diapason-cm.com