
July 29, 2013
Will commodities benefit from China’s rebalancing and the mini-stimulus?
Commentary by Senior Market Strategist Robert Balan
« When written in Chinese the word crisis is composed of two characters. One represents danger and the other represents opportunity. »
John F. Kennedy
Concerns about slowing Chinese economic activity were underlined last week by a weaker-than-expected “flash” manufacturing PMI for July. This data-point adds to some other evidence that points to a lower trajectory of growth for the Chinese economy. The recent softer run of Chinese data finally elicited a policy response from the government of sorts last week, with the announcement of a “mini-stimulus” package, suggesting the authorities are becoming increasingly concerned as economic growth looked to move towards 7%. However, looking at the details of the announced program we do not think these moves will become a 2008-style stimulus set of measures. It may not even come close -- as such this set of mini-stimulus package may not be an immediate game-changer, as many expect.
The announced measures — including tax cuts for SMEs and lower administrative costs for exporters — are geared towards supporting small exporters and businesses, also serving to reduce their reliance on the shadow banking system. This conclusion is backed by the lingering PBoC’s reluctance to contain last month’s liquidity crunch. It appears that the monetary authorities want to contain rapid credit growth, especially in the shadow banking system. While this approach — i.e., not relying on credit-led investment spending — will likely entail weaker growth than in the recent past, the government seems determined to deliver more private consumption-led growth, even at the expense of weaker growth overall. The new Chinese government seem determined to carry on with the rebalancing process.
Given that the mini-stimulus does not seem to be a game-changer — not a broad tide that will lift all boats — what is it's impact on commodities, if any? Which will benefit? Which will lose out? The slow-burning China’s cyclical economic slowdown and rebalancing has already had a negative impact (via trade flows and financial markets) on a number of risk asset prices, including EM equities and commodities.
On the commodity sectors, metal prices (specially Copper) as being relatively the most vulnerable to the shift in priorities, given China’s current role as the world’s dominant metal consumer. The potential losers in this metric are the large metal exporters within EM, such as Chile and Peru -- these countries will likely see reduced export revenue if Chinese rebalancing proceeds further. On the oil sector, diesel and petrochemical products could suffer the most from the shift, while gasoline is likely to benefit the most from a consumption-led growth.
Another clear winner in the commodity matrix from China's rebalancing is the agriculture sector, in line with the shift in focus towards consumption. That effort is finally seeing some results -- Chinese consumer confidence rose two points to 110 last month, as aspirational consumption trends are being driven by urbanization and rising incomes that is pushing private spending higher, most of it in the form of better quality food items (a majority of which are imported). Of the food items that may benefit the most, we pick soybeans and for a short while, wheat. Soybean imports were the sole bright spot in the June agricultural trade data. China’s soybean imports came in at 6.9mn tons –-- an all-time high -- and eclipsing the previous record of June 2010’s 6.2mn tons. China’s wheat imports were slightly lower in June, coming in at 219.4Kt. But we anticipate China’s wheat import demand to remain elevated over the coming months, following damage to its domestic wheat crop.
 |
Main drivers this week
|
Commodities and Economic Highlights
Commentary by Robert Balan, Alessandro Gelli, Marion Megel and Alban De Rougé
The power sector continues to boost crude oil demand
These past few years, the power sector has been a more important contributor to global oil demand as oil is used as a substitute for natural gas due to the lack of natural gas supply in Saudi Arabia, while power consumption rose at a rapid pace. Despite the start of the large Karan gas field in Saudi Arabia last year, direct crude burning remain important. In May 2013, direct crude burning in Saudi Arabia reached 550’000 b/d, close to last year level and up from 300’000 b/d in February 2013. Like in 2012, crude oil use by power plants could rise to around 750’000 b/d between June and September due to stronger air conditioning demand. A warmer than normal summer could even push direct crude burning higher like in August 2010, when it experienced record temperature and led to a rise in direct crude oil burning to 900’000 b/d.
Moreover, Japan continues to use a large amount of oil to generate electricity as nuclear power plants remained shut. In June 2013, about 320’000 b/d of oil (crude oil and fuel oil) was used by the power sector. As power consumption peaks during the summer, oil consumption by the power sector is expected to increase and could reach around 400’000-450’000 b/d by August, depending on temperatures. The Japanese and the Saudi power are hence expected to be more important contributors to global oil demand in the coming weeks. Oil use by the Japanese power sector was nonetheless down by 150’000 b/d y/y in June 2013, due to stronger hydroelectricity generation and the exceptional restart of two nuclear reactors in July 2013.
The decline in crude oil demand by the Japanese power sector could accelerate in the last quarter of 2013 due to the likely restart of nuclear reactors. The Nuclear Regulation Authority, created in September 2012, has started to look at proposals to restart nuclear power plants. The upper house elections last weekend comforted Shinzo Abe’s political position and should allow him to push for the restart of nuclear power plants, a topic which remains unpopular in Japan.
African crude oil supply is set to fall this year
The oil market is characterised by rapid change in fundamentals. These past few years Africa was indeed in turn a net contributor to global oil supply growth or saw a decline in its crude oil output. In 2011, the civil war in Libya contributed to the decline in its crude output by 1.2 million b/d y/y and with lower output in Sudan, Equatorial Guinea and Angola led to a decline in African crude oil supplies by 1.3 million b/d y/y. The latter rebounded in 2012 and rose by 0.6 million b/d y/y thanks to the restart of crude oil production in Libya (+0.9 million b/d y/y), which more than offset the decline in Sudanese crude oil production (-0.3 million b/d y/y).
This year, volatility in African crude oil production is likely to persist and crude oil output could decline, driven by lower crude oil production in Nigeria (-0.2 million b/d y/y in H1 2013), Algeria (-0.1 million b/d y/y in H1 2013) and as Libyan and Sudanese crude oil output are set to decrease. Indeed, protest in rising insecurity has contributed to lower Libyan crude oil exports, while political tensions between Sudan and South Sudanese are likely to lead to the halt of South Sudanese crude oil exports by the end of July. They restarted in April after an agreement was found between the two countries. However, core issues remained unresolved.
Moreover, production in Algeria is threatened by security concerns. BP and Statoil have not send their workers back to the In Amenas facility, 6 months after the attack, due to a disagreement over security with the Algerian government. In Nigeria, crude oil production is likely to remain volatile as oil theft should continue to damage oil pipelines, mitigating the expected growth in crude oil production in Angola, thanks to new oil fields. Overall, African crude oil production (OPEC and non-OPEC) is set to decline by around 0.5 million b/d this year.
Stronger WTI prices could boost crude oil production growth in the Midwest
The decline in the Brent-WTI spread was caused by an important rise in WTI price, which is now above $100 for the first time since May 2012, while Brent price rose only slightly. Stronger WTI price is encouraging oil companies to increase drilling activity in the US Midwest, which could lead to stronger crude oil production growth. Drilling activity indeed fell after the decline in WTI price in mid-2012 and due to high costs. The number of drilling rigs in North Dakota fell from 200 in early June 2012 to around 175 in November 2012 and currently stands between 173 and 180.
Stronger drilling activity can have an impact over crude oil production on the medium–short-term horizon as tight oil projects are more price-elastic due to the rapid completion and strong initial output of such wells, contrasting with conventional oil wells. Last year’s decline in rigs count indeed contributed to a drop in crude oil production growth from +280’000 b/d y/y in May and June 2012 to +165’000 b/d y/y in May 2013. Monthly growth also declined. Between May 2011 and May 2012, crude oil production in North Dakota grew by 23’000 b/d per month in average, while between May 2012 and May 2013, it increased by 14’000 b/d per month in average, reflecting the impact of the lower drilling count, despite improved technological gains. WTI price above $100 per barrel could hence have a positive impact on crude oil production growth in the Midwest.
Drivers for new crop soybean prices
New crop soybean prices will mainly be driven by three factors: the 2013-14 US soybean harvest, Chinese soybean imports and prospects for South American production in 2014.
Recent Crop Progress reports suggest that there is a downside risk for US soybean yields. Indeed, the proportion of soybean rated “good” or “excellent” has fallen by 3 points in the last two weeks to reach 64 percent, the lowest level for this year. Moreover, the critical stage of setting pods is beginning. Therefore, August will be the key month for soybean development and weather will be followed closely by market participants. In addition, the USDA will release any material changes in its acreage forecast from the July resurvey in the August Crop Production report and will await the results of this survey to make changes to its 2013-14 US soybean yield estimate, which it left unchanged at 44.5 bushel per acre in the July WASDE report.
Global soybean trade flows depend largely on Chinese demand. Due to higher prices, China has drawn down its inventories by 4 million tonnes (Mt) to 11.5 Mt at the end of the season 2012-13. However, with greater availability of soybeans and lower prices, analysts expect China to restock over the next crop year. As a result, USDA forecasts Chinese imports at 69 Mt, for the season 2013-14, the highest level on record. If this estimate is realised, it will represent an increase of 10 Mt or a rise of 17 percent year on year.
Taking current prices and government policies into consideration, South American farmers will probably plant more soybeans rather than corn. Brazilian and Argentine farmers will start to make their planting decisions for the 2013-14 crop year in August and September as planting takes place in October and November. In areas where first-crop corn is produced and directly competes with soybeans for area, soybeans should win over some acreage. Indeed the forward ratio of soybean to corn prices point to better returns for planting soybeans rather than corn.
Furthermore, soybean farmers are in a better position to take advantage of the depreciation of the Brazilian real as Brazil has a larger presence in the global soybean export market. Brazil is the first exporter, with an estimate of 42 Mt, before the US with only 39 Mt according to the last forecasts of the USDA. Brazil also tends to have a larger exportable surplus of soybeans relative to corn: it will export nearly half of its soybean production whereas only 25 percent of its corn production.
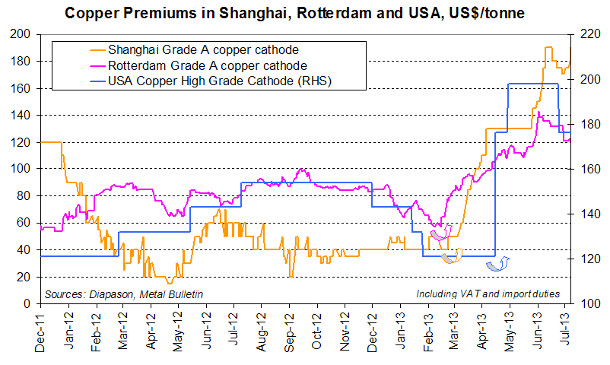
Chart of the week: Copper is paving the way for a tight market after the summer
|
The global copper market is expected to experience a seasonal slowdown in activity in the summer, before rebounding from September this year, when industrial demand should pick up in China and in the US. China’s demand for the red metal has remained resilient in the past months, and in addition, the recent announcement of a new Chinese stimulus plan could also strongly support copper consumption, especially since the focus should stand on the development of the railway network. On the other hand, copper supply is looking increasingly vulnerable: the production losses from Kennecott’s Bingham Canyon in the US (following the massive landslide in April 2013), and from Grasberg in Indonesia (following a tunnel collapse that killed 28 workers), continue to impact the mine supply of the red metal; and the start up of Oyu Tolgoi should not be sufficient to compensate for the losses. Production risks are also rising in Chile, where mining labour contracts will be renegotiated this year. In addition, out of the 600,000 tonnes of inventories currently held in LME facilities, about 500,000 tonnes could be unavailable for consumption. On top of that, the global market is also facing a squeeze in scrap supply, which usually accounts for a third of global usage, because of the slowdown in European industrial activities that limits the replacement process of copper products and because of lower prices encouraging scrap dealers to sit on stocks. Consequently, scrap global availability could tumble by 10% to 20% this year, representing a loss of 350,000-700,000 tonnes of supply, equivalent to the closure of a top producing mine. The shortage of scrap has already prompted three of China’s largest smelters to shut down some operations for a combined capacity of 400,000 tonnes annually, including Jiangxi Copper, Jinchuan, and Yunnan Copper. In addition, China’s inventories have been on a downward trend in the past months and could therefore prove short avec the summer. The sum of inventories held in SHFE and in bonded warehouses is estimated at its lowest level since June 2012. In particular, bonded warehouses’ stocks could have strongly diminished, from more than 900,000 tonnes at the start of the year to just a little more than 500,000 tonnes currently. Following the mine production losses and the scrap shortage, and showing how tight could the copper market be after the summer, premiums remain near record high all over the world, despite the recent slight decrease: In Shanghai, the grade A copper cathode remains priced at $190/tonne over the market fixing, more than doubling from the start of the year. In Europe, premiums for that same cathode have also nearly doubled from just $59/tonne at the end of February 2013 to $120/tonne last week (retreating slightly from the $132/t reached in mid-July 2013). In the US, premiums for high grade cathodes remain at $176/tonne, slightly lower from the early July levels of $198/tonne but still far above the $121/tonne premium seen in April 2013. |
|
|
For the full version of the Diapason Capital Markets report, please contact info@diapason-cm.com